Skip to content
How to Track Essential Milestones in Data-Heavy Research Projects

Data-heavy research projects can involve large datasets, multiple researchers, several review stages, and changing requirements. Effective management uses clear progress tracking to stay aligned.
Without a clear way to track progress, teams can lose sight of what has been completed. Moreover, they may miss upcoming tasks and deadlines.
For data-heavy research projects, researchers ask how to track work with milestones. The most practical approach is to divide the research into clear phases and use milestones to mark outcomes.
This gives everyone a shared view of progress and helps identify delays early.
A milestone should represent meaningful progress, not just another item checked off a task list.
What Is a Milestone in a Research Project?
A milestone is an important checkpoint. It shows a significant stage of a research project has been completed. Additionally, in data-heavy research projects, this outcome helps move the project toward its final goal.
For example, “review 50 survey responses” is a task. “Complete and validate the survey dataset” is a milestone because it confirms that a major stage is ready for the next phase.
Common research milestones include:
- Completing data collection
- Finishing data cleaning
- Approving a validated dataset
- Completing initial analysis
- Reviewing research findings
- Finalizing a research report
A useful milestone should be easy to understand and verify. Team members should know what needs to happen before they can mark it complete.
Why Data-Heavy Research Projects Need Milestones
Data-heavy projects often involve several connected activities. One researcher may collect data while another cleans it, another performs analysis, and someone else prepares the final report.
This creates dependencies. If the dataset is not validated, analysis may have to wait. If an issue is discovered during analysis, an earlier stage may need to be revisited.
Milestones create clear checkpoints between these stages. They help teams answer practical questions such as:
- Is the required data ready?
- Has the dataset passed quality checks?
- Is the analysis complete?
- Have the findings been reviewed?
- Is the final report ready?
Making Research Progress Easier to Communicate
Milestones are not only useful for internal tracking. Research teams may also need to explain complex project stages to managers, clients, or stakeholders who are not involved in the daily research work.
Simple visuals can make these updates easier to follow. A timeline can show completed and upcoming stages, while a vector illustration can represent a research workflow, data process, or milestone structure without relying on lengthy technical explanations.
The visual should support the information rather than replace it. A clear graphic with simple labels can help stakeholders understand where the research stands and what happens next.
Bring your research-heavy work to Nifty and manage it easily. Get started.
How to Set Milestones for a Data-Heavy Research Project
A useful research milestone system needs two levels of visibility.
At the higher level, the team needs to see major phases such as data collection, validation, analysis, and reporting. At the working level, researchers need clear tasks, owners, deadlines, dependencies, and supporting information.
This is where a project management platform such as Nifty can help connect research milestones with the work required to complete them.
1. Start With the Final Research Output
Begin by defining what the project ultimately needs to produce.
Depending on the research, that could be:
- A validated dataset
- A research paper
- An internal research report
- A statistical analysis
- A client presentation
- A published study
Then work backward to identify the major stages required to produce it.
For example:
Final report → reviewed findings → completed analysis → validated dataset → collected data
These major stages can then become the foundation of the project’s milestones.
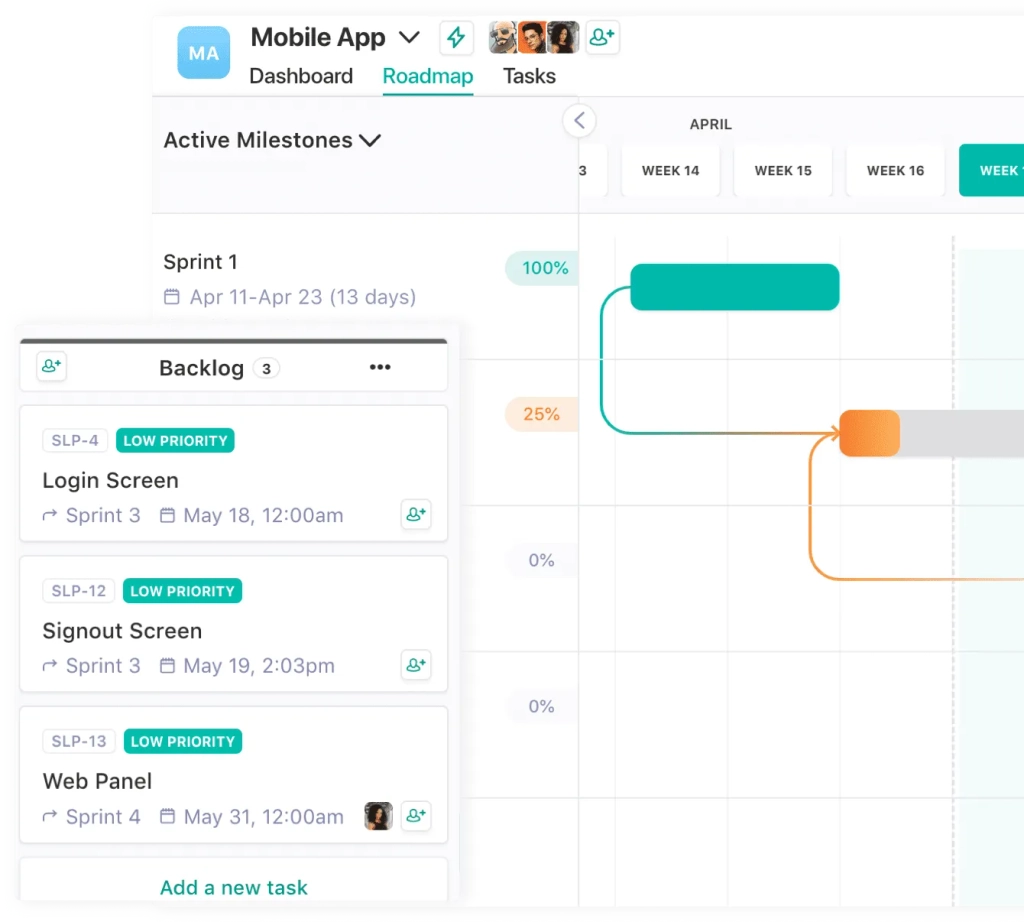
In Nifty, teams can create a project and use the Roadmap to organize these phases as Milestones. A List of related tasks can be displayed on the Roadmap as a Milestone, giving the team both the detailed work and the higher-level research timeline in the same project.
2. Turn Research Phases Into Milestones
Instead of creating one milestone for every activity, use milestones to represent stages where the research has meaningfully advanced.
A typical data-heavy research project might use milestones such as:
| Research Milestone | Example Work Inside It | Completion Standard |
| Data Collection Complete | Gather records, import datasets, check source coverage | Required data sources have been collected |
| Dataset Validated | Remove duplicates, review missing data, standardize formats | Dataset passes agreed quality checks |
| Analysis Complete | Run analysis, test assumptions, document results | Planned analysis has been completed |
| Findings Reviewed | Internal review, revisions, methodology check | Findings have been approved |
| Final Report Complete | Prepare report, visuals, references, final review | Final output is ready for delivery |
In Nifty, each of these phases can be created as a List and added to the Roadmap as a Milestone. Tasks associated with that research phase remain connected to the milestone, so the Roadmap represents actual work rather than a manually maintained timeline.
This distinction matters in data-heavy work. A milestone such as Dataset Validated is much more useful than a vague milestone such as Data Work, because researchers can immediately understand what outcome has to be reached.
3. Break Each Milestone Into Research Tasks
Once the major milestones are established, break each one into the specific tasks needed to complete it.
For example, the Dataset Validated milestone might contain tasks such as:
- Review missing values
- Identify duplicate records
- Standardize date and category formats
- Verify outliers
- Compare record counts with source systems
- Document known limitations
- Conduct final dataset review
Each task can have its own assignee and deadline.
Nifty’s Tasks also support fields such as assignees, due dates, Lists, dependencies, reminders, tags, start dates, and other project information.
For research projects containing dozens or hundreds of activities, List View can be particularly useful. It presents tasks in a table-style layout and can display information such as assignee, due date, status, priority, and Custom Fields. Teams can also filter, sort, group, and bulk-edit tasks without opening them individually.
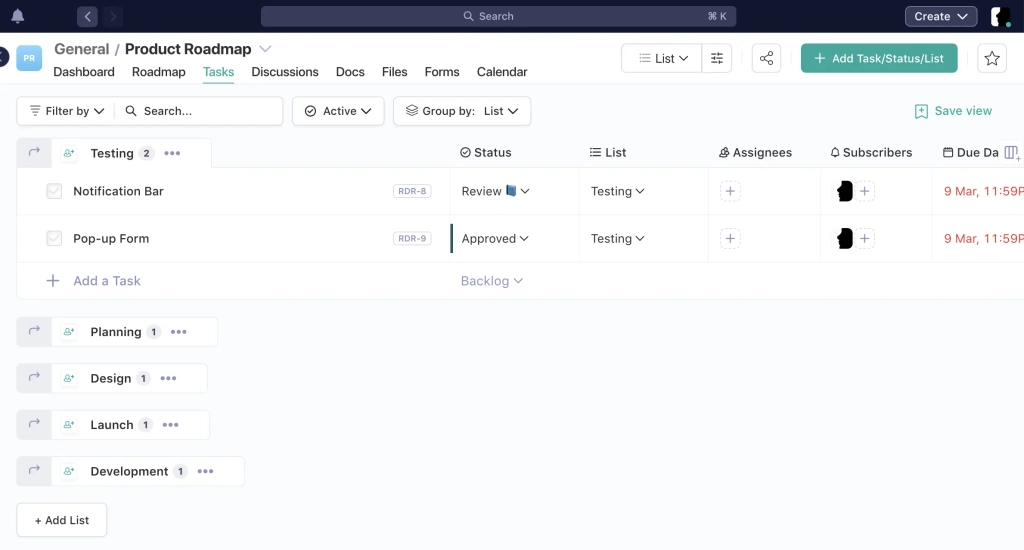
That makes it easier to answer questions such as:
- Which validation tasks are still open?
- Which researcher owns each dataset?
- What is due this week?
- Which items are waiting for review?
- Where are the known data-quality risks?
Use Nifty’s task feature to breakdown your research-milestone into smaller trackable tasks. Get Started for free.
4. Add Research-Specific Information With Custom Fields
Standard project fields are useful, but data-heavy research often requires additional context.
For example, a research team might want to record:
- Data source
- Dataset or file link
- Validation status
- Research method
- Reviewer
- Risk level
- Sample size
- Data owner
Nifty’s Custom Fields can add workflow-specific information to Tasks and Milestones. Available field types include text, drop-downs, numbers, URLs, users, dates, and other structured fields.
For example, a task called Validate CRM Export could contain:
- Owner: Researcher A
- Data source: CRM
- Validation status: In review
- Reviewer: Researcher B
- Dataset link: Cloud storage URL
- Risk level: Medium
This makes the project tracker more useful than a simple checklist. Researchers can see not only whether work exists, but also the context required to evaluate it.
5. Use Dependencies for Research Stages That Cannot Be Skipped
Data-heavy research rarely consists of completely independent activities.
Analysis may depend on validation. Conclusions may depend on analysis being reviewed. A report may depend on multiple researchers completing separate sections.
These relationships should be visible in the project plan.
For example:
Collect dataset → clean dataset → validate dataset → analyze dataset → review findings
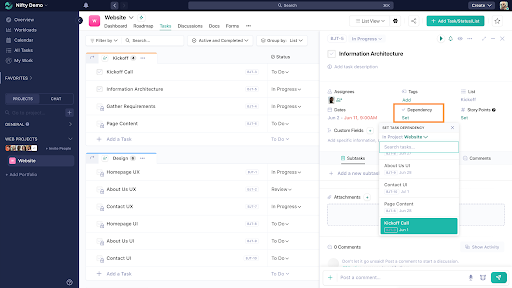
Nifty supports dependencies at the Task, Subtask, and Milestone levels. With a dependency applied, you can edit dependent work, but you cannot mark it complete until the prerequisite is completed. Nifty can also cascade date changes through dependency chains when upstream deadlines move.
This approach helps in research by preventing the project timeline from showing that a later stage is complete while an essential prerequisite remains unresolved.
For example, the Analysis milestone could depend on Dataset Validation. Researchers can still prepare analysis work, but the workflow retains a clear relationship between the two phases.
6. Let Research Progress Update From the Work Being Completed
One problem with milestone tracking in spreadsheets is that progress percentages can quickly become subjective.
A project might remain marked “70% complete” for several weeks simply because nobody has updated the number.
Nifty approaches milestone tracking differently. The progress tracker calculates progress on a Roadmap milestone from the completion of its associated tasks. Its Roadmap also visually distinguishes completed, active, overdue, and not-yet-progressed milestones.
For a research team, that means completing tasks such as:
- Missing-value review
- Duplicate detection
- Outlier verification
- Dataset documentation
Contributes directly to the progress of the broader Dataset Validation milestone.
Researchers continue updating the work they are already responsible for, while project-level progress stays connected to those updates.
This is more useful than asking a project lead to manually estimate how much of the research phase is complete.
7. Choose Auto or Manual Milestones Based on the Research
Not every research project handles deadlines in the same way.
Some studies have fixed submission dates. Others evolve as researchers discover new issues in the dataset.
Nifty provides both Auto and Manual milestone modes.
Auto Milestones are useful when the research phase should follow the dates of the underlying tasks. If task dates change, the milestone’s date range adjusts with them.
Researchers can use it effectively for exploratory research when they do not know in advance how much validation is needed.
Manual Milestones are more appropriate when the phase itself has a defined start and end date, such as:
- Regulatory submission deadlines
- Conference paper deadlines
- Client delivery dates
- Scheduled review periods
Choosing the right model helps the timeline reflect how researchers conduct the work, rather than forcing every project into one schedule.
8. Keep Research Documentation Close to the Milestones
The milestone “Dataset Validated” is more useful when the team can also find the documentation that explains how the team validated the dataset.
Research documentation may include:
- Methodology notes
- Dataset definitions
- Cleaning rules
- Assumptions
- Data dictionaries
- Review notes
- Known limitations
- Analysis methodology
Users can store Nifty Docs within a project and edit them collaboratively. Nifty also supports integrated Google documents, and users can connect project Docs to the surrounding project workflow.
For example, the Dataset Validated milestone could be supported by a validation document explaining:
- What checks were performed
- Which records were excluded
- Which inconsistencies remain
- What assumptions were made
- Who reviewed the final dataset
This creates a better audit trail and makes hand-offs between researchers easier.
Docs, Tasks, Milestone and Reports, all in one place – Nifty. Get Started
9. Give Stakeholders a High-Level View Without Exposing Every Research Task
Researchers and stakeholders do not always need the same level of detail.
The research team may need hundreds of tasks, data-quality notes, dependencies, and review comments. A manager or client may simply want to know whether:
- Collection is complete
- Validation is on schedule
- Analysis has started
- Findings have been reviewed
- Delivery is at risk
Nifty allows Roadmaps to be shared through a public read-only link. External stakeholders can view milestone progress in a browser without needing to be added to the workspace, and the shared Roadmap reflects updated milestone progress.
Roadmap progress reports can also be exported, including milestone names, progress percentages, open and completed task counts, and milestone dates.
This provides a cleaner way to communicate research progress without requiring researchers to repeatedly build manual status reports.
10. Review Milestones When the Research Changes
Research plans change.
A dataset may contain more missing information than expected. A new source may need to be added. Validation may uncover a problem that requires earlier work to be repeated.
When this happens, the milestone plan should change with the research.
Start by identifying what caused the delay and whether it affects downstream work.
For example:
Original workflow:
Dataset validation → Analysis → Findings review
After discovering a data issue:
Dataset validation → Source correction → Revalidation → Analysis → Findings review
If dependencies are already represented in Nifty, changes to upstream dates can cascade through connected tasks, helping the team see the timeline impact rather than updating each dependent task manually.
The purpose of a milestone system is not to preserve the original timeline at all costs. It is to maintain an accurate view of the project’s current state.
A Simple Nifty Setup for Data-Heavy Research
A research team does not need to configure every Nifty feature before starting.
A practical project could begin with:
- Milestones:
Data Collection → Data Validation → Analysis → Findings Review → Final Report - Statuses:
To Do → In Progress → Review → Complete - Custom Fields:
Data Source → Validation Status → Reviewer → Dataset Link → Risk Level - Supporting Docs:
Research Brief → Methodology → Data Dictionary → Validation Notes → Final Findings - Dependencies:
Validation before Analysis → Analysis before Findings Review → Findings Review before Final Report.
This creates enough structure to manage complex research without turning project administration into another research task.
Common Mistakes to Avoid
Milestones are most effective when they represent meaningful research outcomes rather than every action performed by the team.
Avoid:
- Turning every task into a milestone
- Creating milestones without clear completion criteria
- Tracking progress separately from the underlying research tasks
- Starting analysis before required validation is complete
- Leaving data-quality issues undocumented
- Assigning work without clear ownership
- Maintaining a roadmap that no longer reflects the actual research timeline
- Keeping methodology and validation notes in disconnected tools when the rest of the project depends on them
Fewer, well-defined milestones usually provide a clearer picture of research progress.
Key Takeaways
Milestones give data-heavy research teams a way to connect detailed research work with larger project outcomes.
The most useful approach is to define the final output, divide the research into meaningful phases, and connect each milestone to the tasks required to complete it.
With Nifty, those phases can be represented on a visual Roadmap while the underlying Tasks, owners, deadlines, Custom Fields, dependencies, and documentation remain connected to the project. Milestone progress can then update from completed work instead of relying entirely on manual status estimates.
Conclusion
Data-heavy research will always involve some uncertainty. The project tracking around it does not need to.
Clear milestones give researchers a shared way to understand when data collection is complete, whether validation has finished, when analysis can proceed, and what remains before the final research output is ready.
The key is to connect milestones with the work underneath them.
Rather than maintaining separate spreadsheets for tasks, timelines, research notes, and progress percentages, teams can use Nifty to organize research phases as Milestones, connect them to actionable Tasks and dependencies, and monitor progress through the Roadmap.
That gives researchers the detailed workflow they need while providing managers and stakeholders with a much clearer view of where the project stands.
What are milestones in a research project?
Milestones are major checkpoints that show when an important stage of a research project has been completed. Examples include completing data collection, validating a dataset, finishing analysis, reviewing findings, or finalizing the research report.
How do you track milestones in a research project?
Research teams can track milestones using a shared project management system that connects each milestone with its tasks, owners, deadlines, dependencies, and completion criteria. Tools like Nifty can help teams monitor milestone progress through Roadmaps while keeping the underlying research work connected.
What are some examples of research project milestones?
Common research project milestones include data collection completed, dataset cleaned and validated, analysis completed, findings reviewed, methodology documented, and final report approved.
How many milestones should a research project have?
There is no fixed number. The goal is to create milestones for meaningful stages of progress rather than every individual task. A smaller research project may only need four or five milestones, while a larger project may require several checkpoints across data collection, validation, analysis, review, and reporting.
Why are milestones important in data-heavy research?
Milestones help research teams manage dependencies, monitor progress, identify delays, and coordinate work between different researchers. They are especially useful in data-heavy projects because later stages, such as analysis, often depend on earlier stages like data cleaning and validation being completed correctly.

 2026 © Nifty Technologies, Inc. All rights reserved.