Skip to content
 What Is a Milestone Chart and Why Is it Important?

Successful project managers are familiar with the challenges of their jobs. Some of those are a lack of clear goals, tight deadlines, improper resource allocation, and poor communication. Similarly, they are also aware of smart solutions like the Milestone chart!
According to studies, the risks of a project failing are very high:
- A study by IBM found that only 40% of projects meet schedule, budget, and quality goals.
- The Standish Group’s CHAOS Report found that 31.1% of projects will be canceled before they are completed, and 52.7% of projects will cost 189% of their original estimates.
According to an article from the Project Management Institute, one reason that many projects fail is the lack of planning. That is why project managers need to identify risks, dependencies, stakeholders, and communication needs.
To properly plan and succeed, project managers need to use a milestone chart. It helps to measure progress, communicate the status of a project, and track how close it is to the finish line.
Let’s explore what exactly a milestone chart is, how to use it, and how it can help you.
What is a project milestone?
A milestone can be defined as any significant event within a project. It can be the completion of a deliverable, reaching the next stage of work, or accomplishing a key objective.
Milestones are used to track progress and measure success. Milestones have to be identified and agreed upon at the beginning of a project. Clients and team members have to be in alignment with these milestones.
If this is properly done at the start, all project stakeholders will be in agreement when it comes to the nature of the project. The risk of changes and revisions after work has started will be minimized.
Importantly, milestones also help to establish project timelines. They set expectations for when deliverables or goals will be achieved.
Some examples of project milestones are:
- Design approval
- Completion of the requirements gathering
- Delivery of a prototype of a product
- Completion of a testing phase
- Completion of user acceptance testing
That is how milestones can be used as markers to ensure that a project is progressing as planned. They also provide accomplishment and motivation to team members.
What is a milestone chart?
A milestone chart is a simple and effective tool that shows an overview of the status and progress of a project. It is also known as a milestone timeline.
A milestone chart is used to track the development of a project. It can communicate key project milestones to stakeholders. It is displayed as a visual representation of the significant events in a project.
This visual depiction displays a timeline along with specific events highlighted. Milestones can be differentiated by means of color coding. They can also contain a label or brief description of the milestone.
Often, a milestone chart consists of a horizontal timeline with project milestones shown as vertical bars or symbols. It includes additional information such as specific dates, teams involved, and percentage of completion.
Depending on the nature of the project, the timeline of the milestone chart can be divided into months, weeks, or even days. When task dependencies are highlighted and linked to milestones, project managers can see at a glance what to check for and what needs more attention.
A milestone chart can be created by using a spreadsheet or free project management software. We will be taking a close look at the pros, cons, and benefits of such tools.
Benefits of using a milestone chart
As you must have realized by now, there are many benefits to using a milestone chart in project management.
Let’s sum up the major advantages.
- Clear project overview: A milestone chart provides a high-level overview of the project. It highlights key dates and milestones in an easy-to-understand way.
- Helps to track progress: A milestone chart helps the team to monitor progress and identify potential delays or issues that may impact the timeline. Steps can then be taken in advance.
- Manages expectations: A milestone chart sets and manages expectations among stakeholders and team members. Everyone will have a clear idea of what is to be accomplished and how much remains to be done.
- Facilitates communication and collaboration: Because it is clear and concise, a milestone chart can clearly communicate project progress to stakeholders, clients, and team members. It also enables a collaborative environment by providing a shared understanding of goals, timelines, and expectations.
- Improves decision-making: A milestone chart can help project managers make decisions about resource allocation, project priorities, and risks.
- Promotes accountability: When milestones are linked to relevant team members on the chart, it creates a sense of accountability. All members get a clear picture of responsibilities and deadlines.
How to create a milestone chart in Nifty
Nifty is an acclaimed work management tool for project planning and communication. Many project managers find it indispensable.
Nifty’s unique Milestones feature provides real-time automation of work that is in progress, completed, and overdue.
Here is how to create a milestone Gantt chart in Nifty.
Step 1: Define project goals
The first step in creating a milestone chart is to set goals. In Nifty’s Project Scheduling section, you can create a document for this purpose.
List down the project objective and all the goals needed to achieve it. The document of goals can easily be shared with members and collaborators for feedback.
This makes it simple to collaborate and come up with a full list of goals that have been viewed by all concerned.
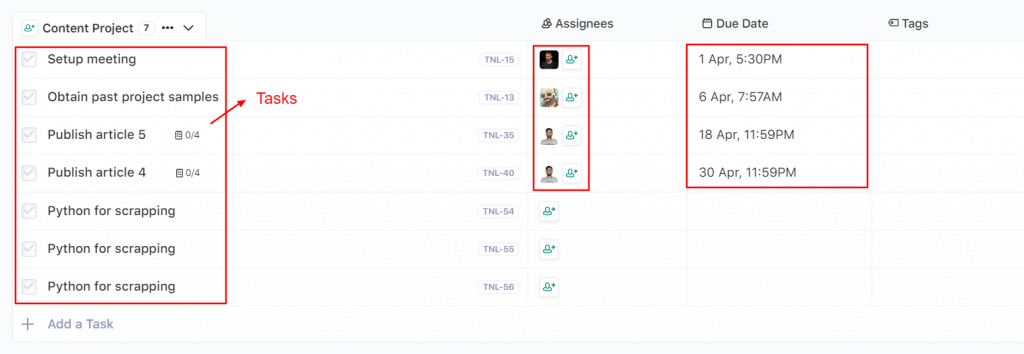
Step 2: Create a task list and assign tasks
Now, the goals have to be broken down into individual tasks. Some of them will be single tasks that complete the goal. In other cases, the tasks will contain subtasks.
Project managers have to be careful about generating tasks, as any loose ends will mean that the goal will not be reached. Once this list is complete, the tasks have to be assigned to relevant team members.
Again, Nifty’s sharing capabilities make this simple.
Step 3: Create milestones
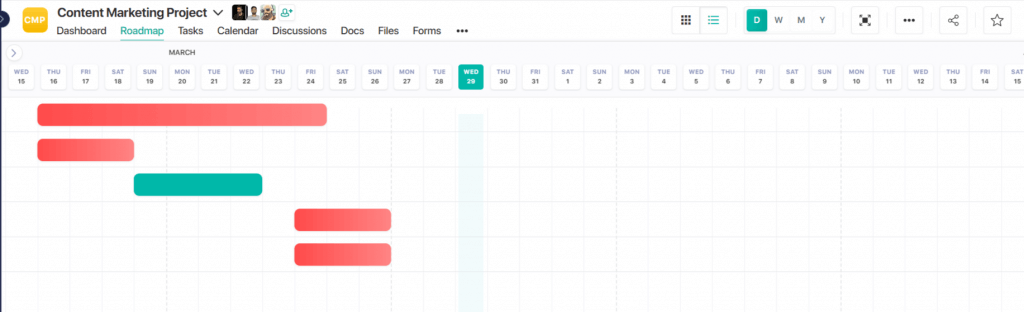
In Nifty, you can use a milestone Gantt chart view. You can create milestones on the Roadmap screen or the Tasks screen. Tasks can be tied to a milestone.
The milestone can be assigned a name as well as a duration. The duration can be adjusted by lengthening or shortening the edge of a milestone.
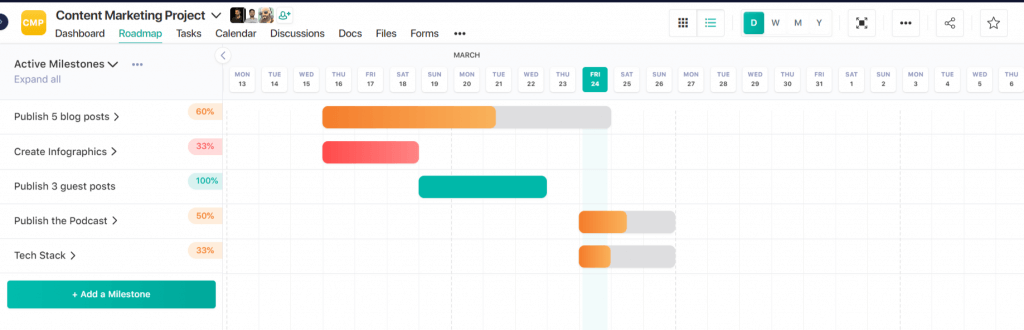
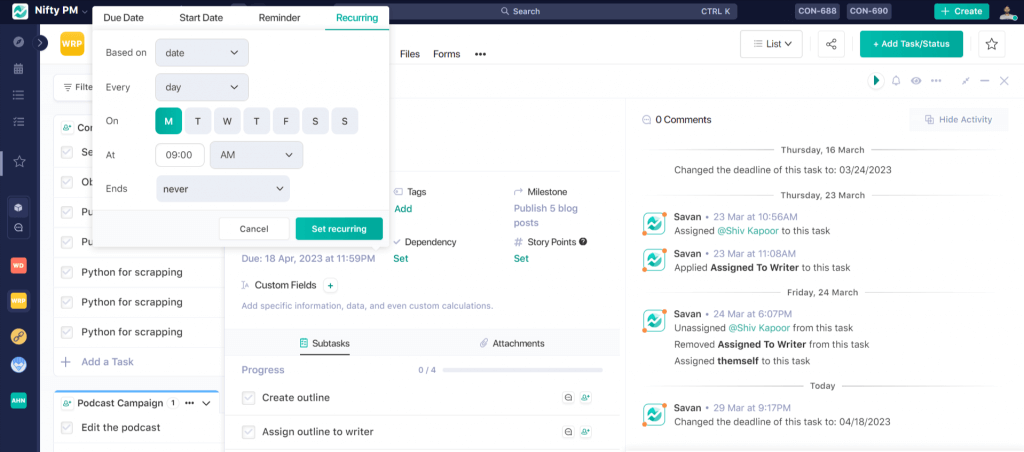
Nifty also allows you to create a daily, weekly, or monthly view. Milestones with tasks tied to them are automated to reflect project progress based on task completion. The status can be color coded.
Step 4: Set deadlines and define dependencies
Clearly, deadlines for tasks and milestones are critical. You can set these individually in the Project Creation mode. The milestones will then show the completion percentage in real time when the tasks within them are completed.
This means you can automatically update project progress even as you manage your tasks. It keeps stakeholders aligned, identifies delays and risks in time, and aligns team members toward project completion.
Similarly, if you have a task that’s dependent on another task to be completed first, you can set dependencies:
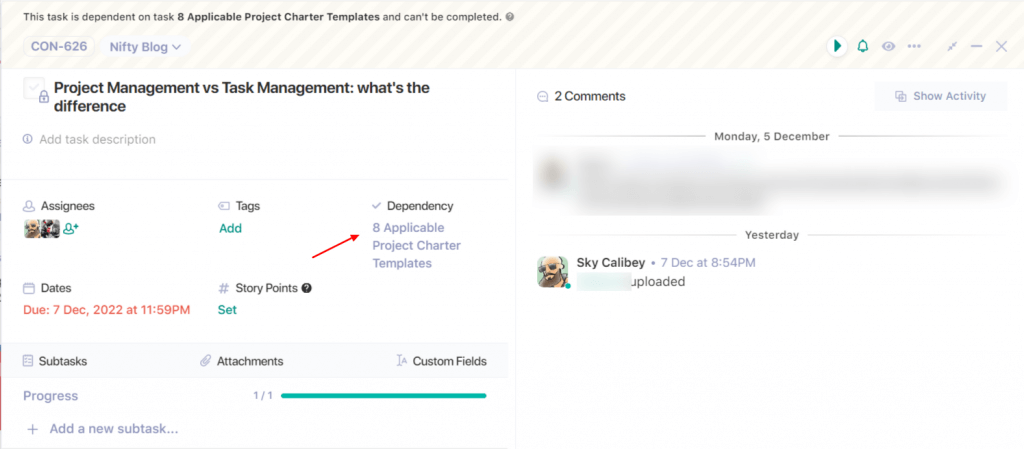
Step 5: Add documentation
Nifty’s Docs feature lets you collaborate with your team members in real time. It can be integrated with Google Drive or Office365 docs with cloud sync. You can add or import all the documents related to the project.
Collaborators can be invited to view the document. Depending on the type of task, the documentation can be shared with different levels of permission. Another helpful feature is that group discussions can be converted into documents for reference.
Step 6: Share it with the team
Naturally, a milestone chart needs to be shared with all those related to the project. In Nifty, they can be shared as public, read-only links that open in a separate web browser.
Members will be able to see progress in real-time as tasks get completed. There can be other levels of sharing, including hidden tasks and separate milestone charts for teams.
Why creating milestone charts in Nifty is better than spreadsheets
The best milestone charts are easy to understand. They are clear and visual representations of time frames. It is easy to add dependencies and show the overall project plan.
A milestone chart can also be created on a spreadsheet, typically using Excel. There are many templates that are available for this.
Milestone charts on spreadsheets do capture projects in a single frame. The software is widely accessible, and you can create lists of tasks, sub-tasks, dates, costs, and task dependencies.
When you use Nifty, however, you remove the complexity from the process. The intuitive frames and variety of displays mean that it is simple and can be tailored to your needs.
On many spreadsheet templates, everything cannot be seen on a single frame. You need to scroll down for details of tasks and subtasks. With Nifty, all milestones and timeframes are easy to spot and manage. You can even set up recurring milestones.
Automation, collaboration, and real-time tracking are built into Nifty. When you create a milestone chart, you have a powerful and up-to-date tool for success.
Best milestone chart tools for Product Managers
You should choose a milestone chart tool that allows you to visualize the key events, objectives, and targets of your project in the best manner. Here are some solutions.
1. Nifty
With Nifty, every company sector can create a milestone chart for their needs. From engineering to software development to sales and more.
The Gantt chart format for milestones is fully automated. Milestone dependencies are easy to keep track of, as are recurring schedules. Custom fields let you add extra data and information to milestones.
What’s more, you can switch between timeline view, swimlane view, and master overview. This allows you to get an overview depending on your needs at any specific time. Nifty works across projects, from simple plans to complex ventures.
2. Miro
With Miro, you get a milestone chart template that gives you the option of a visual timeline and a static chart. The milestone diagram can plan out events scheduled at specific times within the project.
The template lets you identify who is assigned to each task, the status of each task, and any comments for those tasks. There is also a status key to check which tasks have yet to be started, which are paused, and which are in progress.
3. Lucidspark
The Lucidspark milestone chart template lets you visualize key milestones and goals. You can align your teams with an organized timeline. It keeps tasks, deliverables, and outcomes in order.
For simpler projects, Lucidspark also has a timeline template that lets you visualize events within a specific period of time. You can invite collaborators to maintain alignment on important milestones. Lucidspark also has a built-in pie chart generator that helps you create a pie chat to better illustrate your project progress.
In conclusion
Most projects have several tasks associated with them. These tasks need to be successfully completed on time for the project to be a success. Milestone chart project management is an essential way for managers to visualize progress.
Milestone charts come in many forms. Among the most useful are those that offer a compelling visual representation of tasks.
A proper milestone chart offers many benefits. Stakeholders and team members can be aligned, risks can be spotted and managed, and timelines can be managed. The result: seamless workflow and collaboration.
With Nifty, milestone charts can be linked in terms of dependencies, fully automated to show real-time progress, and color-coded for ease of understanding. Sign up now to see it in action!
👉 Also read Best Flowchart Software
What is a milestone chart?
A milestone chart is an efficient way to track progress, monitor important deadlines, and communicate project status to stakeholders. It is a visual representation of project milestones and events plotted along a timeline. It also helps to identify potential issues so that steps can be taken in time.
In a detailed milestone chart, each milestone or event can be accompanied by a brief description or explanation. Milestone charts can be used in various types of projects, including construction, software development, marketing campaigns, and product launches.
What is the typical format of a milestone chart?
A common format includes:
- A horizontal timeline to represent the project’s duration. It could be weeks, months, or years. This is labeled with dates, from the start date to the project completion date.
- Vertical markers or symbols are used to represent milestones or key events along the timeline. Colors can also be used to differentiate milestones.
- Milestone names and descriptions that are concise and clear.
What is the difference between a Gantt chart and a milestone chart?
Both are project management tools to show progress. The key differences are:
- A milestone chart is a simplified version of a Gantt chart that shows the major milestones or events. Unlike a Gantt chart, it does not include detailed information about tasks, dependencies, or resources.
- The focus of a Gantt chart is on information such as task durations, dependencies, and resources, while a milestone chart focuses on key dates or achievements.
- Gantt charts are used for planning, managing, and tracking projects. Milestone charts are for communicating progress and identifying potential issues.