Skip to content
 What Is A Pert Chart And How To Use It In Project Management

Busy project managers, some rescue is coming to you RIGHT NOW. Yes, you can use a PERT chart to help you manage your projects more efficiently – and set aPERT the wheat from the chaff in your project portfolio.
Today, we will introduce you to PERT charts and show you how to use them effectively in project management. It’s easier – and more pleasant – than you think!
What is a PERT chart? a.k.a how to define pert
A PERT chart is a project management tool that provides a graphical representation of a project’s tasks. It helps you to estimate the time required to complete each task and identify dependencies between tasks.
What does PERT in the pert chart stand For?
PERT stands for Program/Project Evaluation & Review Technique.
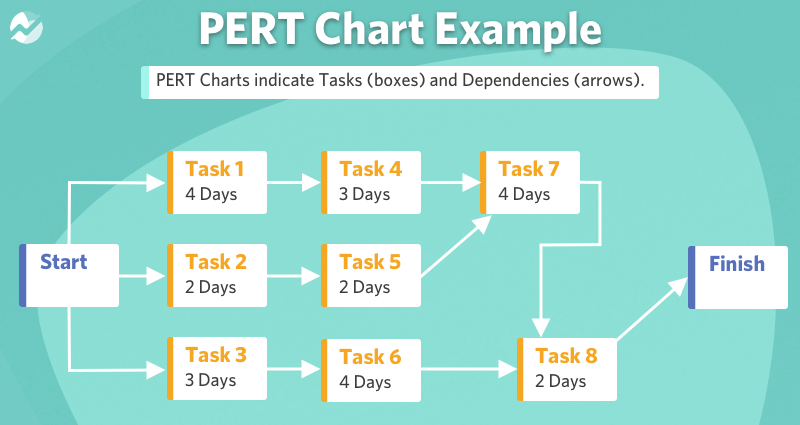
What does the PERT chart look like?
When you google it, you’ll see various different representations of a PERT chart.
However, at its core, the basic layout of a PERT chart consists of three main components:
- A network diagram that shows the sequence and dependencies between project tasks [flow]
- Time estimates for each task, along with their estimated completion date [duration]
- Critical path analysis to determine which tasks are most important and must be completed on schedule [priorities/dependancies]
Benefits of PERT chart in project management
Like each chart under the sun, PERT has a number of advantages for project managers looking to offload some of their activities. In fact, a lot of teams use pert diagrams for project planning. So let’s get into understanding the benefits of the PERT chart
1 Helps to create a project schedule
PERT chart helps you to create a detailed project schedule with information about task dependencies, timing, and resource requirements. Since it’s all crystal clear, it’s much easier to manage and coordinate the different tasks involved in your project.
2 Improves communication between stakeholders
With a PERT chart, you can clearly communicate about the project schedule and goals with everyone involved in the process. This makes it easier to get buy-in from team members and other key decision-makers, helping to ensure that your project moves forward smoothly and efficiently.
3 Helps you to identify potential risks and bottlenecks
Using pert diagrams for project planning, you can quickly identify any potential issues or risks with your project schedules, such as dependencies between tasks that may cause delays or resource constraints that could hinder progress. Having that info in hand, you can proactively address these issues and take steps to mitigate any potential problems.
4 Facilitates better task coordination
Charts tend to be visual by nature, and this makes them a great tool for project managers who need to coordinate the work of many different team members.
With a PERT chart, you can easily see where there are gaps in your schedule or which team members have multiple tasks that overlap or conflict with each other. This enables you to make adjustments as needed to ensure optimal task coordination and optimal project execution.
5 Makes the critical path more visible
Oh, we’ve all been there. You’re knee-deep in project execution, and you lose sight of the big picture.
https://giphy.com/gifs/heyarnold-nicksplat-l4EoOFliX6Vw4PD20
But with a PERT chart, you can easily identify which tasks are on the critical path and make sure that they get the attention they need to stay on schedule. At a glance, you can see where there may be room for delays or if any resources are overstretched, and take the appropriate steps to either reschedule tasks or add more resources as needed to keep in line with the project timeline.
✨ Also see best Flowchart Software Tools to Use
How do you use a PERT chart?
There are a few key steps to using a PERT chart in project management. Treat our list as a starting point, and feel free to customize it as needed depending on the specific needs of your project.
1 Mapping out the workflow
First, you’ll need to map out all of the tasks involved in your project. This may involve:
- gathering information from different stakeholders
- conducting interviews with team members to get a clear picture of what’s required for each step in the process
- reviewing existing documentation and project plans to make sure that they are up-to-date and accurate
This workflow will vary from project to project, but it’s important to ensure that you have a complete picture of all the steps involved.
2 Estimating time and resources required for each task
Once you’ve mapped out your workflow, the next step is to estimate how long each task will take and what resources will be required. This may include things like:
- manpower, as workforce requirements vary depending on the complexity and size of your project or even a particular task
- materials, such as tools or equipment that may be required for certain tasks
- budget, if you have specific financial constraints to consider
You should also reach out to team members who are involved in the project to get a more accurate picture of time and resource requirements – it’s absolutely fine NOT to have all that info in mind.
3 Set up dependencies between tasks
To better manage the flow of your project, you need to keep an eye on dependencies. For example, if one task is dependent on another having been completed, or if there are resource constraints that will impact other team members’ work schedules, you’ll need to ensure that those dependencies are clear and accounted for.
4 Predict bottlenecks
Nothing pleasant about that, but it’s a reality of project management. You should highlight any potential bottlenecks or areas of risk so that you can address them proactively and prevent delays in your project schedule. Using yellow or red colors (avoid grey!) for these tasks can help you to quickly identify any potential problem areas.
5 Group tasks
Many of the project tasks can actually work in clusters, being completed together or having similar resource requirements. Grouping tasks can make your PERT chart easier to read and manage, as well as optimize the flow of resources and information through your project schedule.
Here’s an example to help you visualize it:
- You run an IT relocation service based in London
- You need to plan how the new project is to be delivered
- There are four groups of tasks connected with ongoing support, development, and maintenance
- Tasks are segmented and assigned to the appropriate parties
Not each task will fall under the same category or require the same level of attention, so it’s important to get a good mix of tasks in your PERT chart. But with this simple step, you can use a PERT chart to effectively manage and optimize your project workflow and stay on track from start to finish.
Pro tip: Use task management software to assign grouped tasks.
#6 Create a network diagram
Only when you have this information above you can start creating a so-called network diagram. This is a graphical representation of the tasks involved in your project and how they are interconnected. It will act as an overview of the project schedule and help you identify potential bottlenecks or areas where tasks may be falling behind.
#7 Reassess your PERT chart as you go
Especially if it’s your first try, be flexible and reevaluate your PERT chart on the road. If a particular task takes longer than expected or requires more attention, it may need to be moved up in the schedule. And if another task is completed ahead of time, maybe it can free up some resources for other tasks that are lagging behind.
This might NOT help the project you’re currently running. But for the next one, you can reap the many benefits that it has to offer, having learned all these practices and knowing what did or didn’t deliver.
#8 Communicate with your team and stakeholders
Make sure to keep everyone in the loop on your project schedule. The PERT chart won’t do it for you. A well-organized PERT chart is only useful if it’s used effectively – so be sure to communicate with your team members and key stakeholders as needed. This will allow you to get feedback or input from others and make adjustments to your schedule as needed.
PERT chart challenges
As with any project management tool or method, the PERT chart is not perfect and does have some challenges that you need to be aware of.
1. (Too) simple layout
They say that the beauty is in simplicity, but with PERT charts, there can sometimes be a danger of oversimplifying your project schedule. This can make it difficult to get an accurate picture of the complexity and dependencies between tasks, which may lead to problems down the line. To add some nuance to your PERT chart, you may want to include additional data, such as estimates of risk or duration for each task.
2. Doesn’t allow for precise
It can sometimes be difficult to accurately estimate the time required for each task due to issues such as uncertainty or variability in workflows. You might create a PERT chart that seems clear and straightforward at first, only to find that your project has run into unforeseen delays or complications.
3. Hard to adjust once underway
Clarifying and adjusting your project schedule is an ongoing process, and PERT charts can be difficult to update once you have started executing tasks. You may need to make changes to the sequence or duration of certain tasks, but this can sometimes be challenging with a static PERT chart that doesn’t allow for much flexibility.
It’s not ideal, but sometimes you may need to scrap your PERT chart altogether and start from scratch.
Yes.
Overall, while the PERT chart does have some limitations, it is still a powerful tool for managing complex projects and ensuring that they stay on track from start to finish.
PERT chart vs GANTT chart
When you think about charts, you might picture the classic bar chart or line graph. But in project management, there are two types of charts that are particularly useful: PERT and GANTT.
While both tools have their strengths, it can be helpful to understand the differences between them when deciding which one is right for your project.
PERT charts are best for visualizing the complex interdependencies between tasks and tracking critical paths to keep your project on schedule. On the other hand, GANTT charts are ideal for breaking down large projects into manageable chunks and clearly communicating timelines to stakeholders.
With PERT charts, one can easily identify and track any potential risks or bottlenecks in project execution. And with GANTT charts, one can effectively manage multiple tasks and resources to ensure the continued success of their projects.
PERT charts make it easy to display tasks in so-called boxes and assess resources, while GANTT charts are great for visualizing a project’s timeline and monitoring progress over time. FANTT charts tend to be a bit more flexible too.
Is pert chart the best chart to use for project management?
Yes and no.
Yes, because Pert charts offer a variety of benefits for project managers, including improved communication between stakeholders, better risk and bottleneck identification, enhanced task coordination, and clearer visibility of the critical path.
However, it is important to note that Pert charts are not always the best option for every project. For example, GANTT charts may be more useful for projects with smaller teams or simpler task structures, and they can also be more user-friendly than PERT charts.
Read also: Best Gantt chart Software
Ultimately, the decision of which chart to use will depend on a number of factors, including the complexity and size of your project, your team’s needs and preferences, and any specific technical requirements or constraints. In some cases, even a combination of PERT and GANTT charts may be the best solution. Carefully assess your needs and select the chart that will work best for your project.
Tackle your project charts today
To say that project management is tricky would be a huge understatement. It takes skill, discipline, and attention to detail to manage complex projects from start to finish.
If you are looking for a tool that can help you stay on top of your projects and ensure that everything is running smoothly, then look no further than Nifty. Who understands the complexities of modern project management better than us? With our cutting-edge tool, you can tackle your projects with confidence.
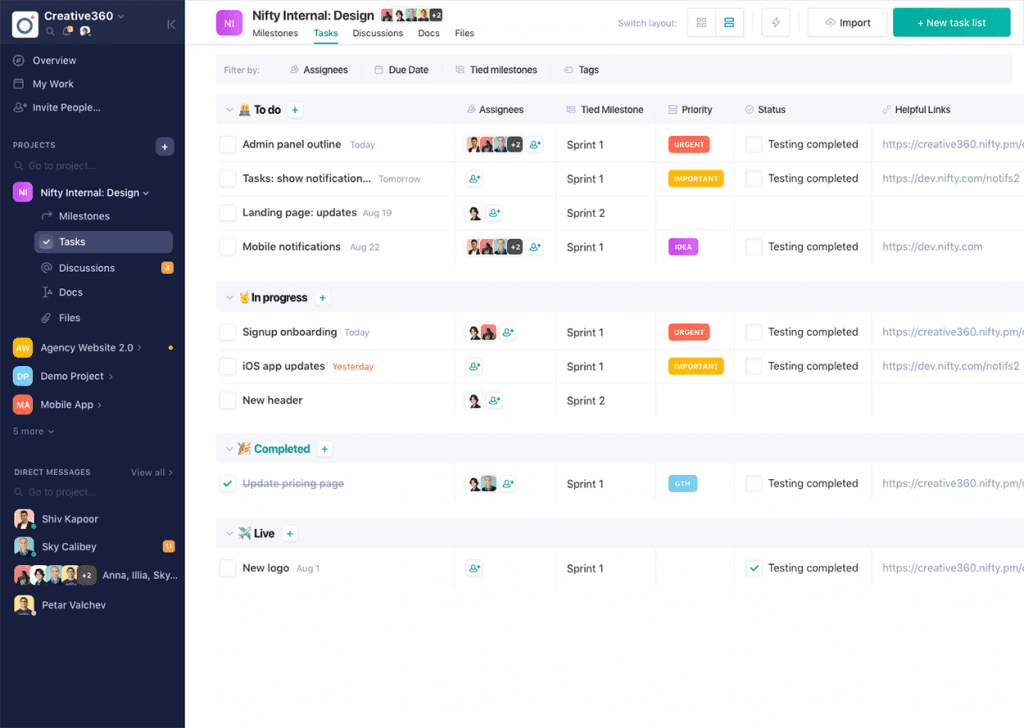
So what are you waiting for? Get started today and supercharge your project management! Let Nifty help you achieve success on every front. You won’t regret it.
Pert Chart FAQ
Why use a PERT chart in project management?
Some of the key benefits include improved communication between team members, more efficient task coordination and execution, enhanced risk and bottleneck identification, and clearer visibility of the critical path.
What are some challenges associated with PERT charts?
It can be difficult to update and adjust once your project has started. They may also not be the best solution for smaller or more simple projects, as they often require more complex and technical tools.
What industry is the PERT chart most suited to?
PERT charts are often used in projects with multiple interdependent tasks, such as software development or engineering. However, they can also be useful for a wide variety of other industries and applications.
Is the PERT chart better than the GANTT chart?
Both PERT and GANTT charts have their own strengths and weaknesses. While PERT charts may be more useful for complex projects with multiple interdependent tasks, GANTT charts are often better for smaller and simpler projects.
What can you do to make sure your PERT chart is effective and useful?
Consider all the relevant factors when choosing which type of chart to use. This may include things like the size and complexity of your project, your team’s needs and preferences, any technical requirements or constraints, and so on.
Keep your PERT chart up-to-date and adjust it as needed throughout the project lifecycle. And, on top of that, you may also want to consider using a combination of PERT and GANTT charts in order to maximize the effectiveness of both tools. Because… why not?