Skip to content
 14 Best Reporting Tools for Quick Decisions in 2026

Keeping your team aligned on pending tasks is not enough. You need to make your team’s achievements visible with the right reporting tools, such as project reporting software, resource management software, time tracking software, etc.
These online reporting tools use data to showcase your team’s efficiency. We understand you may not have the time to research the best reporting tools, so we’ve done the grunt work for you.
In this guide, we’ve created a list of reporting tools and compared their features, pros and cons, and pricing to help you make the right choice. Let’s go!
What Are Reporting Tools?
Online reporting tools empower organizations to collect, organize, analyze, and transform complex data into easy-to-understand graphs and charts.
This data is sourced from multiple data sources such as Excel sheets, databases, cloud applications, and social media. The reporting tool extracts insights and presents repeatable trends for the team to understand.
These tools create data in easy-to-digest formats such as graphs, tables, pie charts, dashboards, and so on.
14 Best Free Reporting Tools to Keep Updated in Real-Time
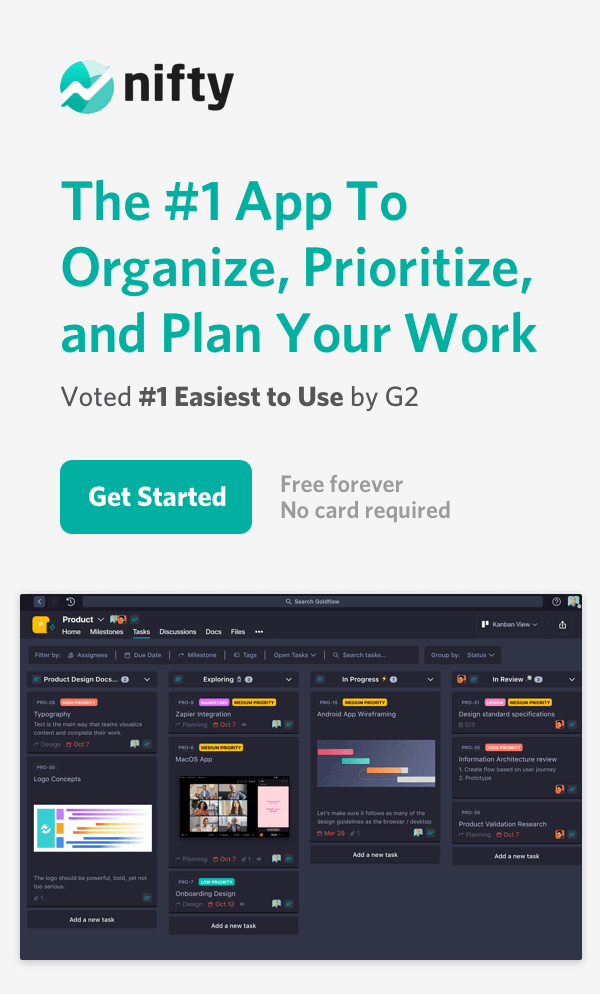
1. Nifty: Best Project reporting software
When it comes to data-backed, gorgeous reports, Nifty takes the lead by offering a seamless experience. You’ll find it incredibly easy to create stunning visualizations and create reports that bring your data to life.
Nifty is a diverse and affordable project management platform that combines reporting and collaboration into one tool. Its reporting functionality is extensive and easy to understand, and you can customize your requirements for a variety of use cases and roles.
What Makes Nifty a Good Reporting Tool?
Nifty offers a bird’s eye view of your timelines and projects within your workspace—an essential component of reporting. After all, you can’t report what you don’t see. The tool’s reporting feature enables project managers to report on critical touchpoints within a project such as ongoing as well as completed tasks, time logs, and activities.
Dashboard-style Reports: Nifty provides a robust reporting system by bringing your workspace and project tasks into an interactive dashboard with highly visual reports:
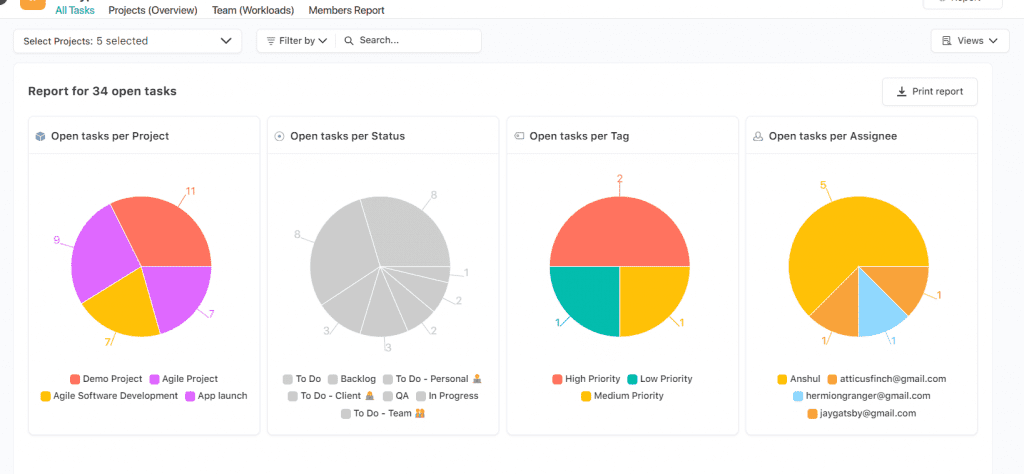
You can effortlessly generate and share these visual reports with stakeholders at one-click. More importantly, you can dive into mission-critical project metrics such as status, project, assignee, tag, and more.
Time tracking: If you’re looking to boost productivity and manage team workloads, Nifty’s time tracking feature is right up your alley. With meaningful time logs, you can track billable hours and gain valuable insights, as shown here:
Your team can monitor time spent on tasks and track billable hours. You can instantly access automated reports and filter insights of your project’s time logs as per team members or tasks. You can also look at “tracked hours” from the Team Overview tab and balance your team’s workload without much effort.
Pros:
- Users can report the whereabouts of their tasks, projects, and documents, all from one tool
- Nifty’s time tracking feature produces professional-looking reports, which users can download in PDF or .CSV format
- You can connect your reports to the project with the time-tracking feature
- Project milestones functionality automates status reporting and makes it easy for your team to visualize the project schedule easily
- The software is intuitively designed and is not overly complicated to use
Cons:
- The tool offers advanced project management features in the paid plans
Pricing:
- Free forever plan: $0 (with unlimited users and tasks)
- Starter plan: Starts at $5/user
- Pro plan: Starts at $10/user
- Business plan: Starts at $16/user
Use Nifty for all your project reporting.
Get Started Free
2. Emitrr
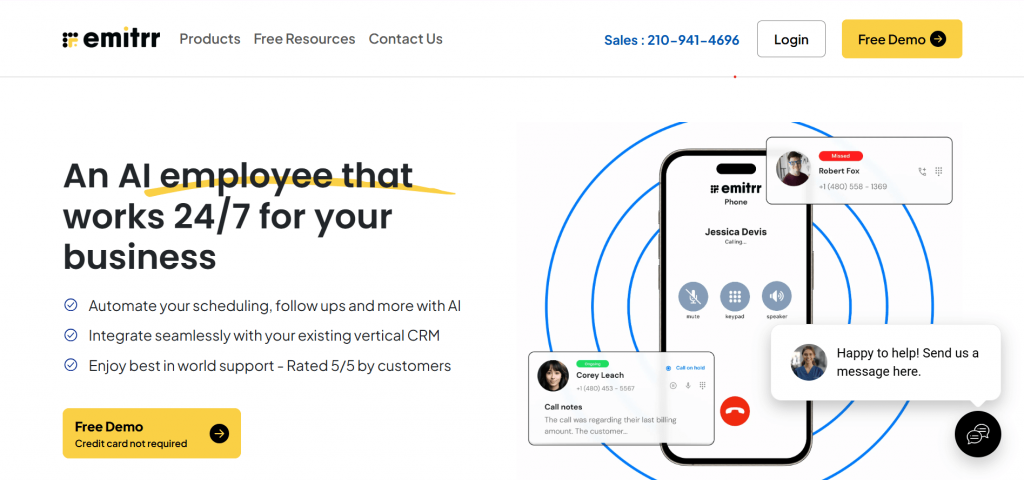
Emitrr is an AI-driven customer communication and automation platform that also delivers powerful real-time reporting to help businesses make faster, data-backed decisions. Designed for service-based industries like healthcare, real estate, and home services, Emitrr centralizes calls, texts, voicemails, and reviews into one clean dashboard — providing visibility into customer interactions and performance metrics at a glance.
Its built-in analytics track engagement, response times, missed calls, and campaign effectiveness, giving teams the insights needed to optimize communication strategies quickly. With automation features like AI-powered call handling, appointment reminders, and follow-up messages, Emitrr doesn’t just report performance — it improves it in real time. Seamless integrations with popular CRM and EHR systems ensure that all your data flows smoothly across tools without manual work.
Pros:
- Real-time reporting on calls, messages, and customer interactions
- AI automation reduces manual communication tasks while maintaining accuracy
- Integrates with major CRMs and EHRs for complete data visibility
- Easy-to-navigate dashboard with actionable analytics
Cons:
- Advanced reporting features are still expanding for niche use cases
- Some users may need time to explore all automation and analytics tools
Pricing:
- Basic: US$30/month per user for VoIP service
- Standard: US$149/month for SMS automation
- Premium: US$250/month for combined SMS + VoIP features
- Enterprise: Contact sales for custom plans
3. Zoho Analytics: Best for 360-degree Business Data Reporting
Zoho Analytics is a great tool for converting business data into insightful reports and dashboards. Owing to its data analytics capabilities, it can handle vast amounts of data effortlessly and access clear, impactful visuals that make data interpretation a breeze. You can also combine data from different sources to build comprehensive, cross-functional reports.
More importantly, sharing and collaborating on your reports and dashboards has never been easier. With this powerful business intelligence software by your side, you can rest easy knowing your data is protected with robust security features like role-based access controls.
Pros:
- The platform is intuitive and simple to use for creating reports, thanks to its drag-and-drop report builder
- It allows users to connect with Zia, an AI-powered data analytical assistant who can offer valuable business insights quickly and powerful visualizations
- The tool seamlessly integrates with different data sources, consolidates the information, and analyzes it easily
Cons:
- Some users feel that the platform has a steep learning curve, particularly for newer project managers who want to create custom reports but have no data analysis background
- The free version offers restricted customization options
- Some users also complain of slow loading times for data uploading within reports
Pricing:
- Basic: US$24/month, billed annually
- Standard: US$48/month, billed annually
- Premium: US$115/month, billed annually
- Enterprise: US$455/month, billed annually
- Custom: Contact sales
4. Celoxis: Best for Data-backed Teams
Want comprehensive, real-time insights across your projects and teams? Leverage Celoxis’ powerful data analytics platform with its robust reports and dashboards.
You can create detailed reports using custom fields. Plus, you can dive deeper with custom drill-down charts and perform bulk actions on multiple records at once.
For convenience, you can download these reports and dashboards as PDFs and schedule email deliveries to keep everyone informed.
Pros:
- It offers multiple shared dashboards, each of which you can tailor to your specific needs
- It allows integration with popular tools like Jira, Salesforce, etc.
- Its user interface is highly customizable, particularly for workflows and reports
- You can customize widgets to fit your viewing preferences and resize them for optimal viewing on your dashboards
Cons:
- Some users find the pricing to be too steep, especially for smaller teams with shoestring budgets
- Avid users also feel that the analytics can do with more fields and be improved upon
Pricing:
- Manager: $25/month, billed annually
- Team: $15/month, billed annually
Leave your project reporting hard work to us.
Get Started
5. Jira: Best for Agile Teams
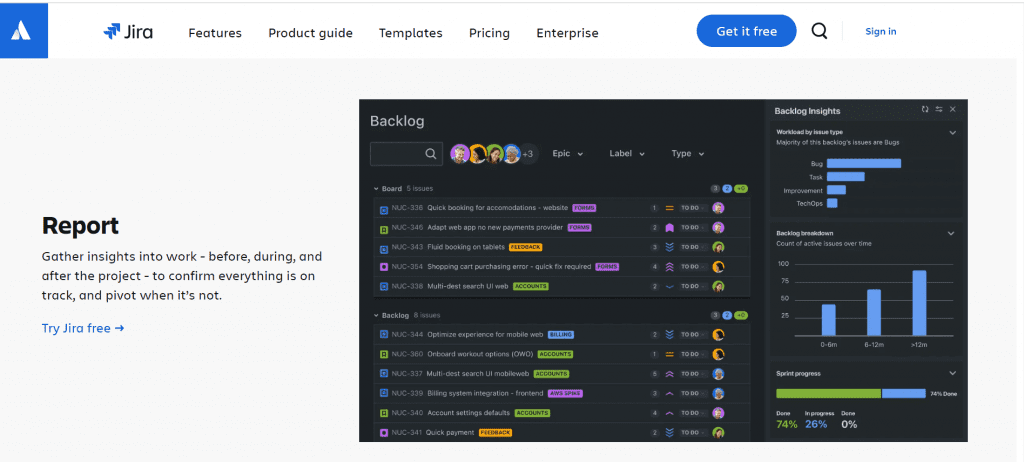
Atlassian developed Jira, a robust project management tool that focuses exclusively on agile methodologies. Its powerful reporting features allow you to create customized dashboards and reports, track goals, and use flexible data charts to monitor your projects.
Jira excels at providing in-depth analytics for on-point performance. You can also take a proactive approach and spot potential issues to make informed decisions.
Additionally, Jira’s ability to track key performance indicators (KPIs) makes it an essential tool for monitoring project performance and success. If you want to tailor your reports to show key metrics such as project status, issue types, velocity, and team performance, Jira allows you to do it and share said reports easily with key stakeholders.
Pros:
- The tool offers comprehensive reporting and insights into your project progress as well as team performance
- It generates reports easily and helps the team track bugs with advanced filters
- It offers agile tools, including scrum and kanban boards, to address the specific needs of your team
- The platform offers extensive visualization tools and integrates with numerous tools, such as Slack, Microsoft, Google Workspace, Zoom, and many more. You can even build your own integrations using Jira’s API
Cons:
- It is a complex tool with a steep learning curve
- Some users also feel that the UI is too overwhelming at times
Pricing:
- Free: $0
- Standard: $7.16/user/month
- Premium: $12.48/user/month
- Enterprise: Custom pricing
6. HubSpot: Best for Business Reporting
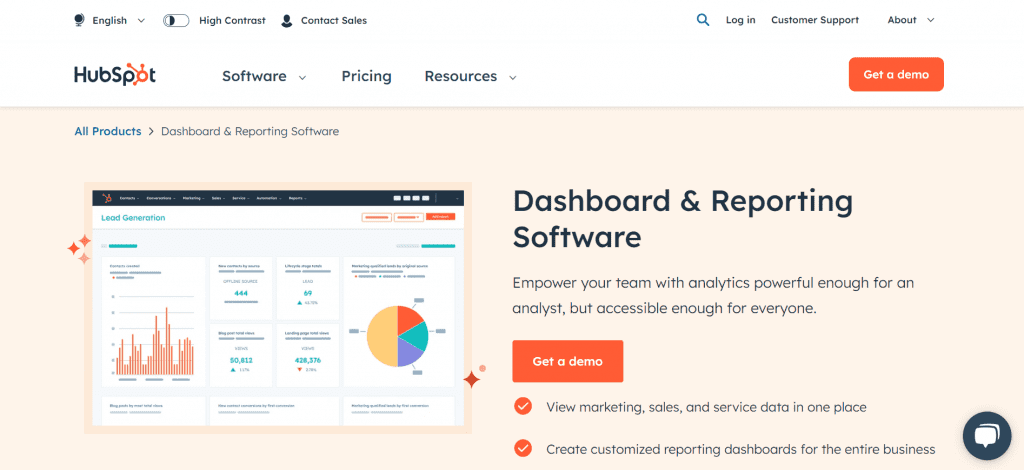
HubSpot’s Dashboard and Reporting software empowers your team with powerful analytics. Designed with business users in mind, it offers user-friendly features that make it accessible to non-technical users. You can connect your CRM data to your sales, marketing, and customer service data in one place and build a single source of truth.
Pros:
- It provides advanced reporting permissions to help keep your data safe and secure
- It helps you to build high-level or specific custom dashboards for your team and leadership or use pre-built dashboards with popular use cases
- You can combine multiple reports and track multiple metrics for your teams
- Its dashboard template library helps you to map your reporting to your business needs
Cons:
- Some users find the platform to be too pricey
Pricing:
- Marketing Hub Professional: Starts at S$1,120/mo (includes 3 seats)
- Marketing Hub Enterprise: Starts at S$5,100/mo (includes 5 seats)
- Free Tools: $0
- Marketing Hub Starter: Starts at S$21/mo/seat
- Starter Customer Platform: Starts at S$21/mo/seat
- Marketing Hub Professional: Starts at S$1,120/mo (includes 3 seats)
Do you know Nifty also offers great business reporting capabilities? Know more
7. ProWorkflow: Best for Graphical Data Reports
If you manage remote or hybrid teams, ProWorkflow is perfect for you. It lets you see all your projects, tasks, time logs, contacts, workflows, and resources in one place. You’ll love how it handles invoicing, messaging, file sharing, and timelines, making it an all-in-one tool for managing your workflow.
Additionally, ProWorkflow excels at handling and visualizing raw data, allowing you to turn raw data into actionable insights for informed decision-making.
Plus, if you’re using Microsoft products, it integrates nicely with Microsoft Teams and Outlook. Just keep in mind that it doesn’t have as many integrations as some other tools, so you might need to manually enter some data.
Pros:
- Users love the time tracking feature as it is accurate and easy to use
- The dashboard has tools that are logically located, allowing users improved control over projects
- The tool’s comprehensive mobile app allows for remote working, especially when it comes to managing organizational data
Cons:
- The platform is known to have an extremely high learning curve, as per some users
- It also lacks technical support and tutorials to help users get up to speed
- Considering it isn’t an all-in-all reporting tool, it falls short of advanced reporting capabilities
- Some users also report that its customization is difficult to set up
Pricing:
- Professional: $18/month, paid yearly
- Advanced: $27/month, paid yearly
- Enterprise: Custom pricing
8. Clockify: Best for Time Tracking Reports
Clockify is a popular free-time tracker for teams. If you wish to use online time reporting software, Clockify enables the team to see how they’re spending their time and get visual reports.
Some important time-related metrics Clockify enables you to see include:
- Which employee took time off
- What kind of revenue does each project bring?
- Which team member is working on what and on which day?
Pros:
- It is extremely simple to use as it works as a timesheet app—but within your browser
- It allows you to deep dive into the tracked time by way of Detailed, Summary, and Weekly reports
- The Dashboard feature helps you to see where you’re spending the most time and what your team is focusing on. It gives you a complete overview of all tracked hours across teams, as well as a total of all billable hours
- The Summary Time Report lets you dive deeper into your tracked data where you can break it down and analyze it using filters for project, department, user, group, tag, and date
Cons:
- It does not allow for easy customization of time reports
- The Import functionality is too tedious for large-scale projects with multiple tasks, as per some users
Pricing:
- Basic: $3.99/user/month, billed annually
- Standard: $5.49/user/month, billed annually
- Pro: $7.99/user/month, billed annually
- Enterprise: $11.99/user/month, billed annually
9. Bamboo HR: Best for HR Reporting
Want to build full-fledged HR reports within seconds? Bamboo HR is one of the best online reporting tools for analyzing people’s data. The tool helps you build a centralized database of HR data so that you can drive strategic decisions.
Most organizations struggle with tracking disjointed and scattered sensitive employee data. Bamboo HR makes this process easy by pulling all the data together in one place.
Pros:
- The tool is extremely easy to navigate as per some users, helping them generate instant HR reports with the least resistance and effort
- It offers 49 built-in reports to help you make sense of the data and streamline data management
Cons:
- Some users complain of limited integration options within the tool
- Others also claim that the system can be challenging to navigate post-implementation
Pricing: Custom pricing
10. Reportei: Best for Digital Marketing Reports and Dashboards
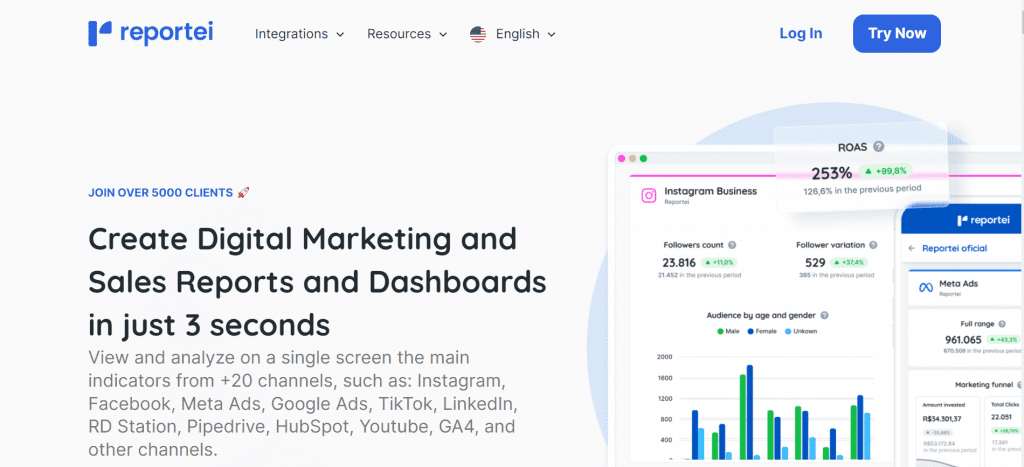
If you need to create digital marketing reports on the fly, Reportei is perfect for you. It focuses on social media data and analytics, making it best suited for agencies, freelancers, and marketing professionals who want to spend less time creating reports and more time analyzing results.
If you wish to adjust your report metrics with ever-changing campaign objectives, Reportei makes the job simpler for you.
Pros:
- The marketing timeline feature lets you add events and milestones throughout your project and helps you track progress efficiently
- The platform offers a host of built-in tools to accelerate your digital data analysis
- It integrates seamlessly with platforms such as Facebook, Instagram, LinkedIn, YouTube, etc., and offers easily-assembled reports at one click
Cons:
- The tool’s AI feature is not up to the mark, as per some users
- Other users also complain that managing templates is not practical or easy
- It doesn’t allow users to create unlimited dashboards with lower-priced plans
Pricing:
- Starter: USD $24, paid monthly
- Pro: USD $39, paid monthly
- Premium: USD $79, paid monthly
Create a marketing reports dashboard with Nifty.
Get Started
11. Power BI: Best for Marketing Reports
Power BI is an online reporting tool that converts complex data into visually appealing insights. It seamlessly integrates data from various sources and presents it in a way that’s easy for your team to understand.
Compared to other tools like Google Data Studio, Power BI offers robust integration capabilities, making it a versatile choice for building reports and designing data visualizations.
Perfect for both large enterprises and growing businesses, Power BI handles substantial data loads effortlessly. This powerful business intelligence tool from Microsoft allows you to create automated reports, interactive dashboards, and comprehensive visualizations of your marketing data.
Pros:
- If you are familiar with other Microsoft products, such as Excel, this tool is easier to use
- You can securely share insights with colleagues and embed interactive reports into your apps
- Its data transformation capability provided by Power BI (Power Query) helps transform data on the go
- It’s great for building project and status reports as it offers a user-friendly interface
- With over 120 free connectors and integration with data sources such as Excel, Salesforce, and Azure SQL Database, Power BI stands out in the analytics arena
Cons:
- Some users report that the tool is difficult to use if dealing with large amounts of data
- Its reporting and dashboard functionality tends to become slow at times
- The process of uploading reports from the desktop to a cloud platform can be time-consuming
Pricing:
- Free:
- Power BI Pro: $10/user/month
- Power BI Premium Per User: $20/user/month
- Power BI Embedded: Custom pricing
12. nOps: Best for Cloud Reporting
Need to pull up cost reports and share them among departments? Or maybe you want weekly reports on your team’s performance? Either way, nOps is the tool for you. You can also get instant reports of security violations. nOps has been branded as feature-rich for users, which includes its reporting capabilities.
Pros:
- Its graphical user interface (GUI) and detailed reports in CSV format help drive agile data analysis
- The tool is easy to set up and use
- The software offers actionable and descriptive insights for the team to use
- It is also highly configurable, allowing you to set up notifications and alerts as you need
Cons:
- The dashboard interface can be more customizable
- Some users want the data to be more illustrative
- Others report difficulty in downloading the remediation report of high-risk vulnerabilities within the organization
- Customers also report glitches during reporting
Pricing: Custom pricing
13. Wrike: Best for Collaborating on Project Reports
Wrike is one of the best tools for project management and data reporting. The Project Dashboards feature helps track productivity, metrics, and project progress while facilitating collaboration among multiple users.
As one of the leading data reporting tools, it also allows you to bring more transparency to your executive team with visual and engaging project reports.
That’s not all. You can customize it to create unique dashboards with widgets tailored to your projects. If you prefer, you can use project reporting templates for generating quick reports.
Pros:
- Once tasks are assigned, you can generate reports to track the amount of work completed within a specific timeframe
- Its reporting tool is comprehensive, and the in-built automation helps reduce repetitive tasks
- The Project Management Dashboards drive visibility into project progress and empower managers with the-moment insights
- You can create dashboards for multiple use cases, such as individual, team, or executives
Cons:
- Some users claim that the software lacks features for agile reporting
- The tool also does not offer a complete overview of the entire company
- Its reporting and analytics capabilities can be more intuitive
Pricing:
- Free: $0/user/ month
- Team: $9.8/user/ month
- Business: $24.8/user/ month
- Enterprise: Custom pricing
- Pinnacle: Custom pricing
14. Circleboom Twitter: Best for Social Media Reporting and Follower Analytics
Circleboom is a comprehensive tool designed for users who need quick, actionable insights from their Twitter data. Whether managing a personal account, business profile, or brand, Circleboom offers detailed follower analytics to help you understand your audience more deeply. It provides essential data, such as follower demographics and engagement trends, allowing users to make informed decisions and optimize their social media strategy for growth.
A key feature of Circleboom is the ability to export follower lists for external analysis, making it easier to refine targeting and content strategies. Additionally, the Create Rival Report feature enables users to analyze competitor accounts, providing valuable insights into their follower activity, engagement, and growth strategies. Along with tools for mass unfollowing inactive accounts and AI-powered tweet generation, Circleboom ensures that you can manage your social media effectively while staying ahead of the competition.
Pros:
- Offers detailed follower analytics, including demographics, engagement, language, and location data.
- Allows users to export their follower lists for advanced analysis and strategy development.
- Provides customizable dashboards for real-time monitoring of follower growth, engagement metrics, and tweet performance.
- Enables mass unfollowing of inactive and spam accounts to keep your follower list relevant.
- Includes AI-powered tweet generation based on audience insights for creating engaging content.
Cons:
- The wide range of features may feel overwhelming to first-time users.
- The free version offers limited analytics and export options.
Pricing:
Business: $29.99/month (custom features for larger organizations)
Free: $0
Pro: $ 9.99/month (includes follower export and advanced analytics)
Premium: $16.99/month (ideal for businesses managing multiple accounts)
3 Top Features of Free Reporting Tools You Should Look For
The right online reporting tool combines project management features with seamless data visualization capabilities. It should be versatile enough to help you create marketing reports, financial reports, and project management reports.
If you’re looking for a checklist of must-have features for reporting tools, read on:
- Collaboration: Your project’s reports are vital to your stakeholders and your team at large. You should be able to share them with them in various formats, such as email, chat, and so on.
- Data visualization: The tool should be able to present important data, such as essential KPIs, in the form of dynamic reports, immersive dashboards, and interactive charts—using Excel sheets just won’t cut it. Put another way, the reports the tool provides must be easy to understand and intuitive. To build dashboards that load fast and feel native, teams can pair reporting tools with developer-focused libraries like Wijmo’s JavaScript UI Components for data grids, charts, gauges, and pivot tables. These lightweight, TypeScript-based controls integrate with REST/Excel data and support sorting, filtering, and drilldowns, perfect for embedding interactive visuals in web apps without heavy custom code.
- Analytics: Given that your team will be dealing with different data sources during the project, the online reporting tool should pull real-time data using strategic templates. With updated information as the backbone of all your decisions, you’ll be able to forecast your project’s needs easily.
Give Your Reporting an Edge with Online Reporting Tools
As a project manager, it’s your responsibility to make processes easier for the team. This includes helping them “decode” (for lack of a better term) complex data. After all, data is the backbone of high-performing organizations—you use data to understand where your team is outperforming and where it’s falling short of client expectations.
This is where investing in a reporting tool pays off. The software does all the background work—from pulling real-time data across sources to converting it into highly visual, simplified reports. So, whether you want to get buy-in from executives or motivate your team, an online reporting tool will do the job for you.
So, take your pick from the list of reporting tools presented here and empower the team with the plug-and-play reporting software of their dreams. Sign up for Nifty now.