Skip to content
 How to Make A Gantt Chart? 7 Easy Steps Walkthrough + Examples

If you’re still fiddling around with the question, “How to make a Gantt chart?” You have come to the right place.
A Gantt chart in project management is vital today for various reasons:
- Simplify complex projects into an easy-to-digest plan
- Monitor the project’s timeline at one glance
- Track task status, milestones, project deadlines, etc., as the project moves toward completion
- Identify and address delays with optimal resource management
- Make real-time edits and keep everyone informed
In this advanced guide, we’ll learn everything you need to know about Gantt charts—from tips on how to create the best Gantt charts to how you can use Nifty, an all-in-one project management tool, to create winning Gantt charts on the fly.
Additionally, you can find free Gantt chart templates for PowerPoint, Google Sheets, Excel, and Word. These templates will allow you to create visual project timelines, track project progress, and collaborate with team members online.
Let’s go!
But What is a Gantt Chart?
A Gantt chart is a project management tool that helps you visualize the entire project timeline and schedule to ensure everyone’s on the same page. With the aid of visual data, you can plan and manage your projects better.
A Gantt chart has two primary axes:
- Horizontal Axis (X-Axis) represents time: This axis is divided into intervals such as days, weeks, months, or years. It allows you to see the project’s timeline and the duration of each task. A close examination of the horizontal axis helps you:
- Determine when tasks are scheduled to start and end
- Identify overlapping and sequential tasks
- Vertical Axis (Y-Axis) represents tasks/activities: This axis lists the activities and milestones due for the project. Each task is represented as a separate horizontal bar. The length of each bar corresponds to the duration of the task, and its position on the chart indicates the start and end dates. Examining the vertical axis allows you to see the project’s structure and the sequence in which tasks should be performed.
Check out some project milestones examples by Nifty
How to Create a Gantt Chart to Manage Projects?
We’ve established how Gantt charts let you represent a project over time. Given its simplicity, you can use an Excel sheet or even Google Sheets to make a Gantt chart.
An Excel Gantt chart template can be a useful tool for creating Gantt charts quickly and efficiently. However, there’s no competition when it comes to using a Gantt chart within an all-in-one project management tool like Nifty.
Let’s now explore key Gantt chart features, and learn how you can create a Gantt chart in Nifty. It’s simpler than you’d think:
Step 1: Collaborate with everyone involved—from your team to your stakeholders—with a streamlined Gantt chart
Ask any project manager and they’ll say that project success is dependent on how well and how often the team communicates. If your project’s updates are unavailable at the team’s fingertips, important information can slip through the cracks.
Using online Gantt chart software can provide real-time updates and improve collaboration among team members, ensuring everyone is on the same page.
So, don’t let disjointed tools and scattered emails prevent your team from understanding what’s happening where. Use, a Gantt chart instead to keep your project team members in check and your stakeholders informed.
Nifty consolidates your tasks into Gantt-style project Milestones, which automates your project’s progress. Within Nifty, Gantt charts are known as Roadmaps.
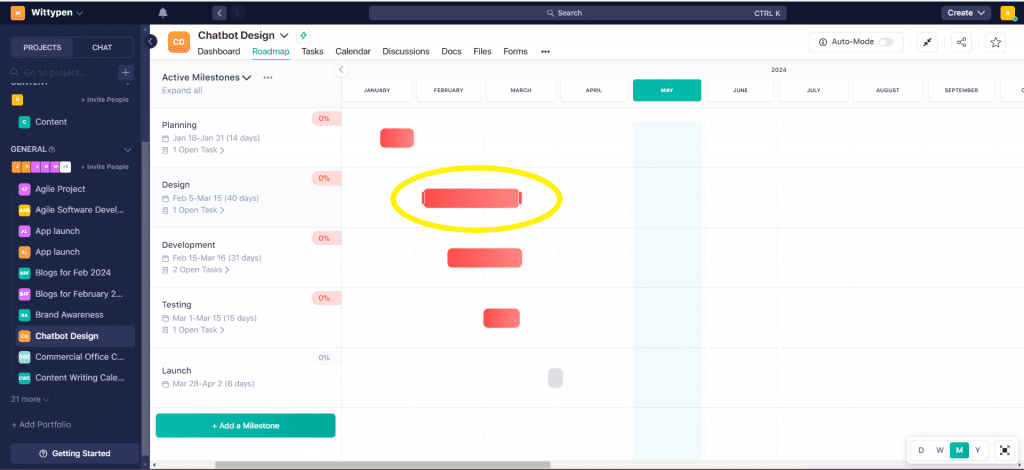
Here’s an example of a Gantt chart for a Personal To-Dos project:
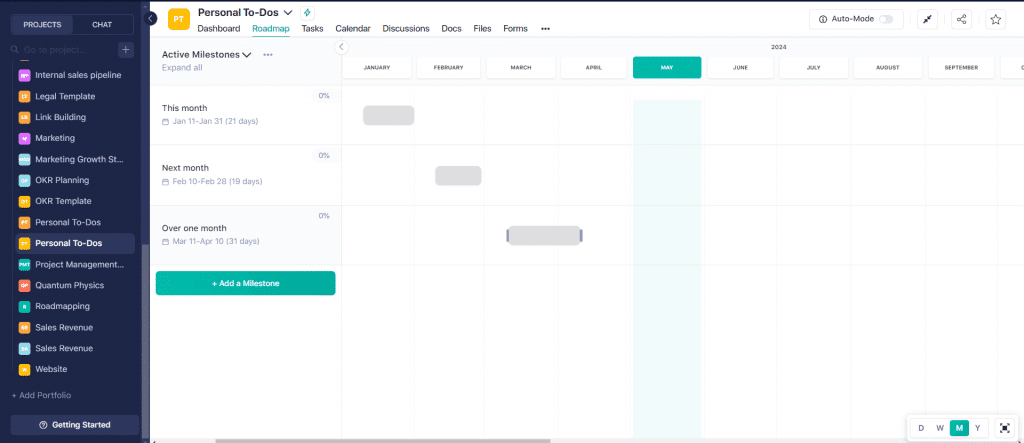
The Roadmap you see above doubles up as a visual project guide and helps you manage your projects successfully. It automates your milestone progress as you complete tasks along the way.
What makes Nifty’s Gantt charts collaborative is the Discussions feature, which allows you to tag team members and drive real-time conversations. You can also share important files and discuss issues/updates related to tasks.
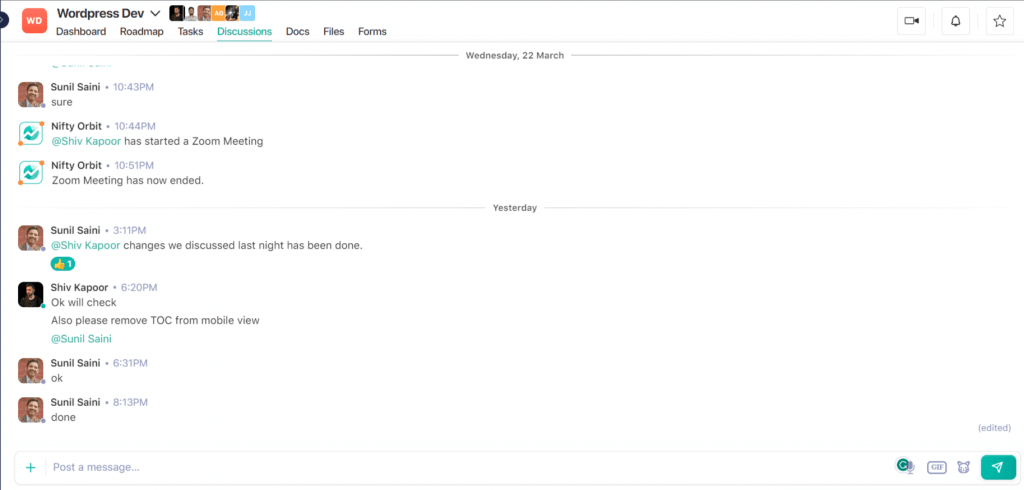
This is so, you can hold your team members accountable for pending work and assign immediate tasks, all in one place.
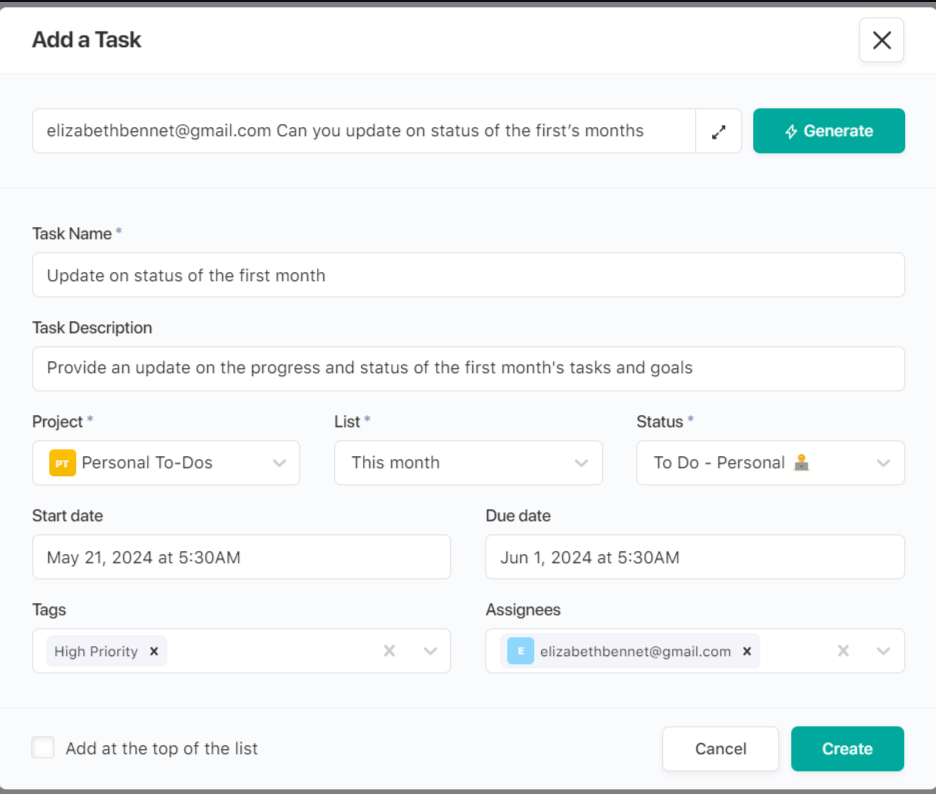
That’s not all. You’ll be able to add a task within the chat as soon as you hit the send (arrow) button and capture all relevant details in a jiffy:
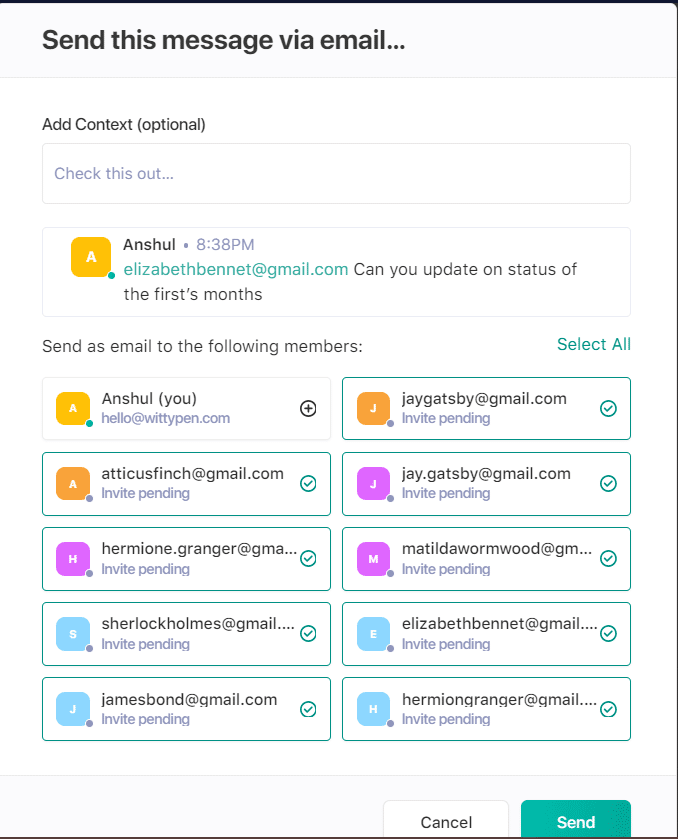
And if you need to make this information widely available, you can even share your chat via email:
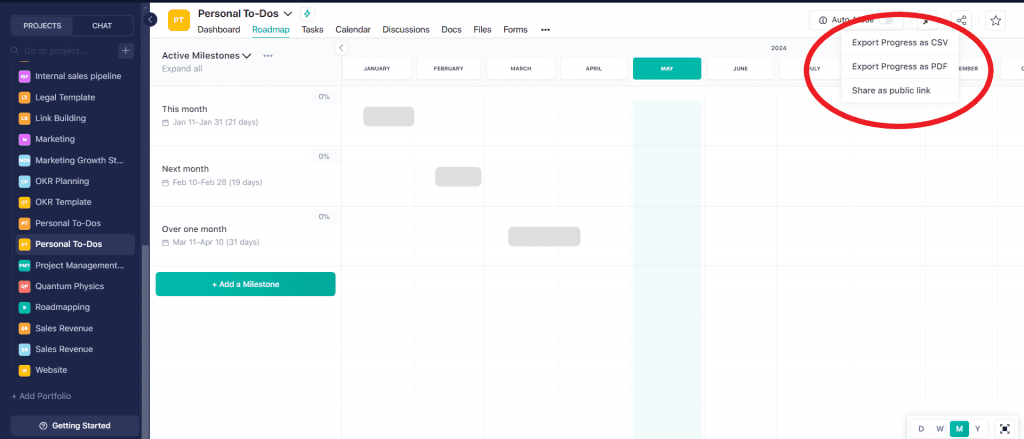
If you’re worried about keeping your stakeholders in the loop, Nifty’s Gantt charts come with an in-built share functionality, allowing you to share the chart as a PDF, CSV, or a public link:
All in all, Nifty offers intuitive project management features with built-in collaboration tools like chat.
Step 2: Monitor available resources and manage team workloads without breaking a sweat
If you are looking for a dynamic Gantt chart that requires little effort to create, Nifty is for you.
Nifty’s Gantt chart offers a Roadmap view of your project’s milestones and goals automatically—you don’t need to do anything. With one glance, you can manage your team member’s workload effectively. You get to see the project schedule in real-time and adjust your resources accordingly.
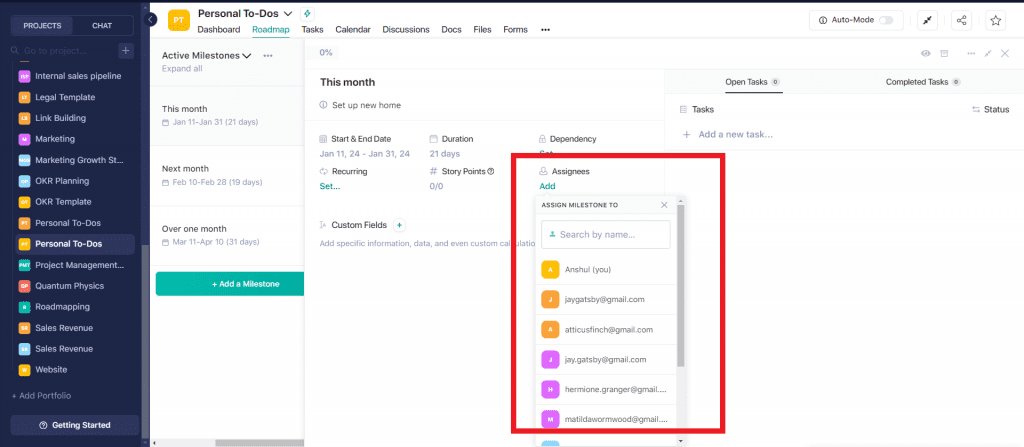
Here’s an example of a milestone within a Gantt chart where you can assign the milestone to specific team members within the project. Simply search for the team member you want to assign the milestone to:
Managing your team’s workload is beneficial for obvious reasons: Your project gets completed on time without overburdening the team.
Step 3: Figure out how much time and effort your project actually needs.
Managing your project resources is not enough. You also need to estimate the effort and time needed for your project to be completed within budget and deadline.
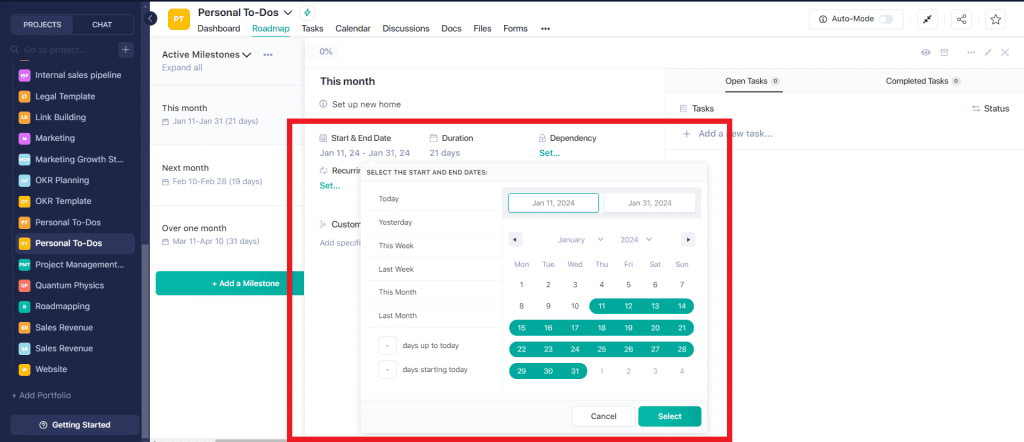
Nifty’s Gantt charts also allow you to estimate the project’s duration accurately, including when it should start and end. The Roadmap feature allows you to scope the project’s estimated timeline with great ease in a calendar format:
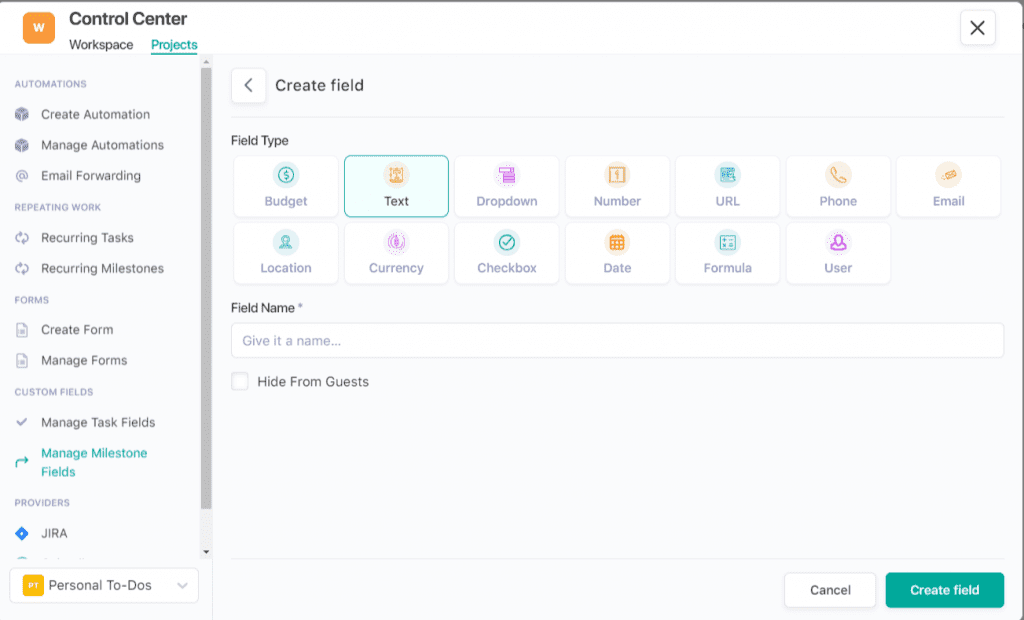
You can also go granular and estimate the project effort in terms of budget, currency, etc.:
The more in-depth you go, the better you’ll be able to define your project’s parameters and get the team working on the same page.
Step 4: Keep a close eye on project progress, especially against timelines and estimates.
You’ve done the work, defined the timelines, assigned the tasks, and the works. The next and most important step is to track your project progress—a signature of Gantt charts.
Using Gantt chart online tools allows for real-time tracking and progress updates, making it easier to plan, schedule, and collaborate with your team.
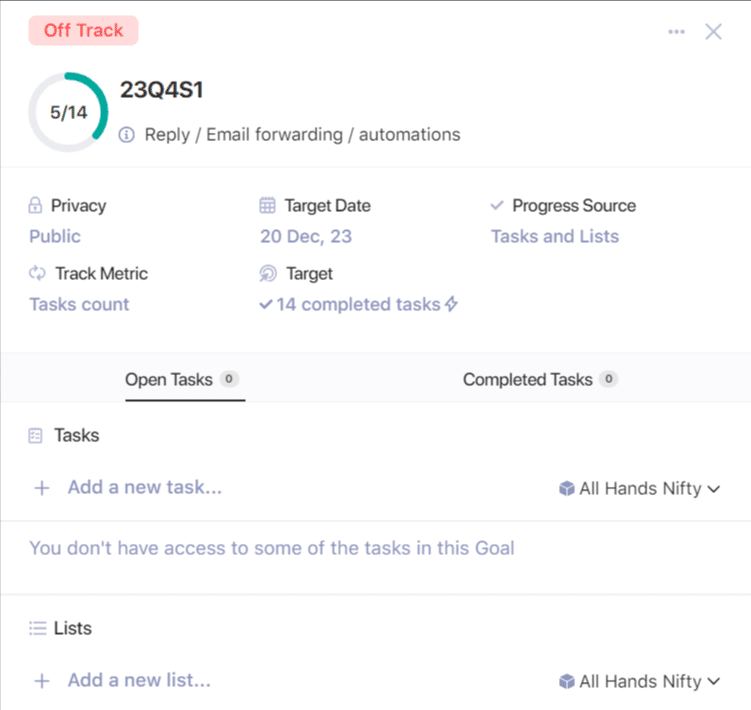
Nifty provides a 360-degree view of the open and completed tasks to help you map them against the project’s deadline and track progress:
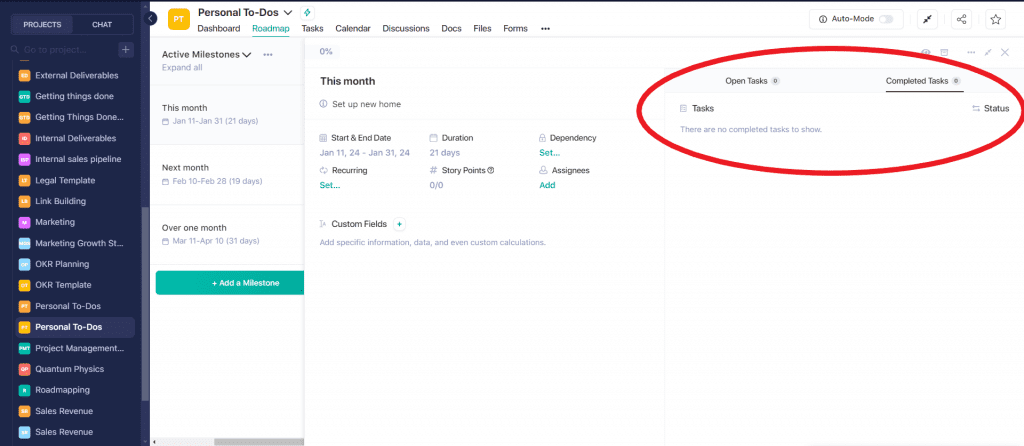
With a crystal-clear view of how much work is complete, you can inform your stakeholders, customers, and the team at large and drive project visibility.
Build your next Gantt chart in Nifty.
Get Started Free
How Do Different Teams Use the Gantt Chart?
Departments and teams across the board use Gantt charts—from project managers and team leaders to executives and business owners.
Here are some Gantt chart examples to see this visual project management tool in action for different teams:
1. Marketing Team
Gantt charts are a game-changer for marketing teams.
Here’s how: They give you a clear, visual snapshot of your campaigns. With a better understanding of the intricacies, you can plan out every detail, from content campaigns to social media launches:
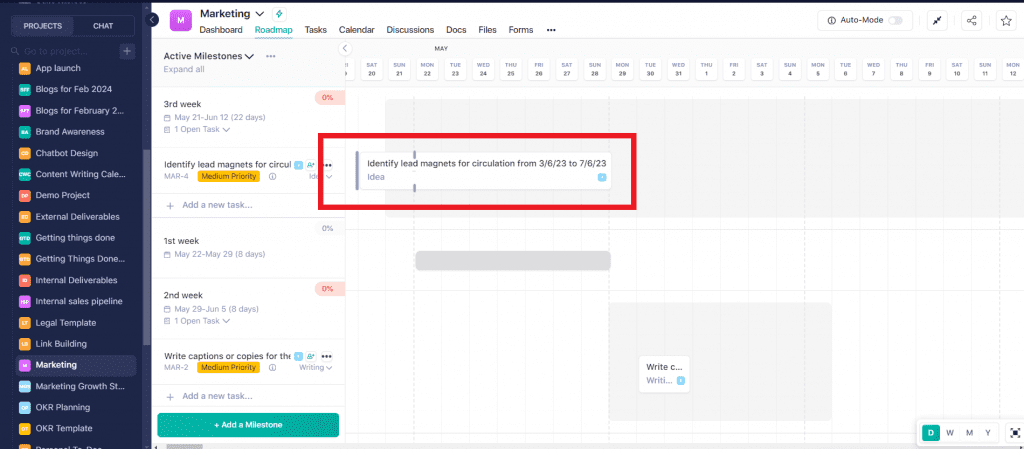
Irrespective of the project you’re involved in, you can break down the marketing activities into basic stages such as planning, content, design, development, launch, and maintenance.
Using Gantt charts, you can:
- Easily set deadlines
- Assign tasks to team members
- See how everything fits together
- Track progress in real-time and keep everything on schedule
- Make sure resources are used wisely
This way, your team stays coordinated, and your marketing efforts run without tension or friction.
Use Nifty to manage your marketing project.
Get Started
2. Construction
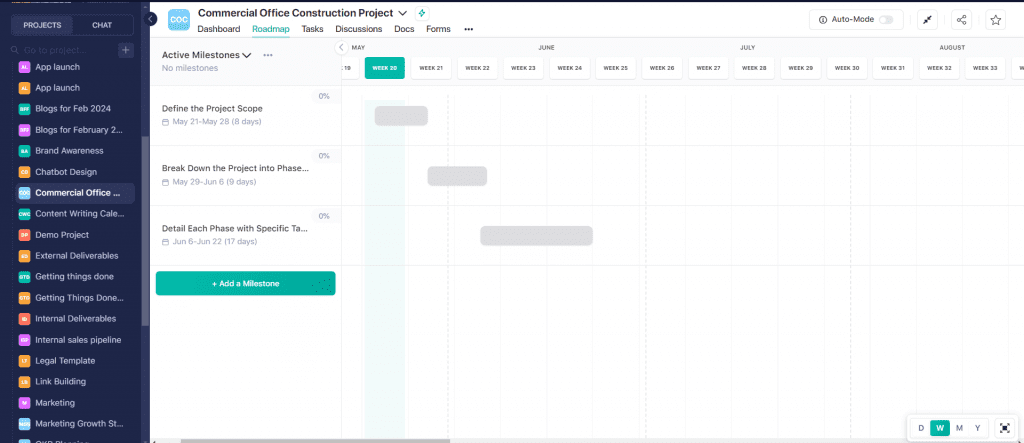
Construction managers can also leverage Gantt charts to plan and manage the phases and tasks of a construction project, including initiation, pre-construction, procurement, and post-construction.
To start with, they can break the project down into simpler and smaller tasks. Each task can be allocated resources optimally along with realistic timelines:
More importantly, construction managers can assign important tasks as strategic milestones. Common examples you can take inspiration from include getting contract sign-offs, conducting inspections, and so on.
3. Human Resources
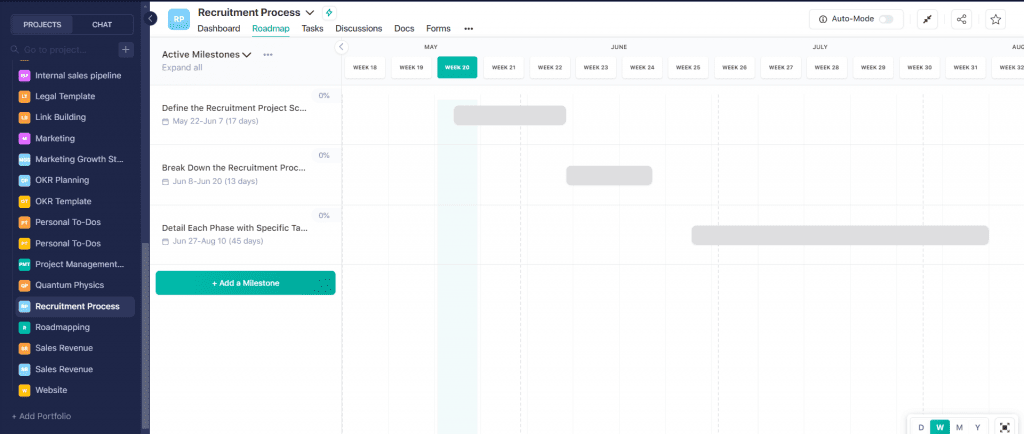
Let’s say you have a huge recruitment drive coming up with multiple stages, from sourcing to onboarding. Here’s how a Gantt chart can make your life easier. Use it to:
- Map out each step of your recruitment drive
- Assign responsibilities according to each step within your recruitment process
- Set timelines based on the recruitment stage you’re in
This visual representation helps you see the entire recruitment process at a glance, and ensure everything stays on track:
You can also communicate the plan to key stakeholders and keep everyone aligned. In short, use a Gantt chart to guide you through the complexities of HR projects with beautiful, functional, and data-driven charts.
4. Software Development
Software teams are often seen embracing a hybrid style of working.
To complement this software development methodology, Gantt charts can be used.
You can organize your tasks into groups based on sprints. And you can track these sprints by monitoring them against set milestones.
Software development teams can use Gantt charts for agile project planning, as shown below:
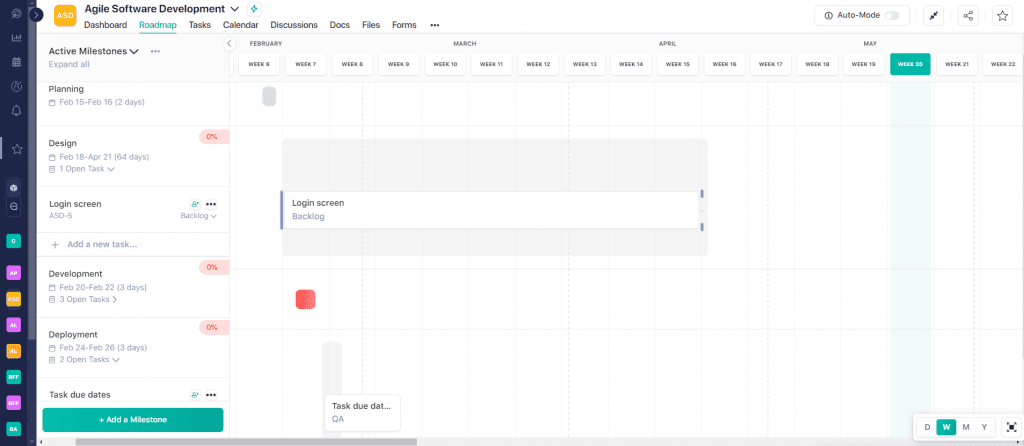
Whether you want to organize tasks within sprints, identify task dependencies, assign team members, or monitor progress, a Gantt chart delivers on all accounts.
Integrating your Gantt chart with your organization’s agile practices allows your team to be flexible while ensuring results-driven project management.
Tips and Best Practices To Follow While Making a Gantt Chart
Building a Gantt chart requires some basic knowledge of project management.
Let’s now explore a few expert-backed tips and best practices on how to make a Gantt chart:
Tip #1. What are your project goals? Define them
The first task is to chart out a comprehensive project plan to understand your project goals. You can’t create a Gantt chart if you don’t know your project’s end goals.
Here are a few data points you must include when writing your project plan:
- What are the most important deliverables and milestones for the project?
- What is the deadline for the deliverables? Are there any dependencies we need to be aware of?
- Do you have the required resources, tools, etc., to manage the milestones efficiently?
- Which departments and teams will form your ultimate project team? What role will they play in getting the project to the finish line?
- Will you need to involve stakeholders for approvals? Who will they be, and how will you keep them in the know?
- How will you assess the team’s ability to meet the milestones?
Defining short-term vs long-term goals is crucial for complex projects like a construction project, where phases and tasks need to be clearly outlined.
Once you have the answers to these questions, write a comprehensive project plan and get the team together to kickstart the project planning process. You can do it manually or get assistance using project planning software.
Tip #2. Create a thorough list of your activities
Your Gantt chart is a simplified version of the important tasks and activities within your project, such as:
- Breakdown of the project into tasks
- Start and end dates for each task
- Duration of each task
- Team members responsible for each task
- Interdependencies and relationships between tasks
- Timing of key meetings, approvals, and deadlines
- Current status of task progress
- Comprehensive project timeline—from initiation to completion
Compared to other project management charts like PERT charts and Kanban boards, Gantt charts offer a unique visual representation of the project schedule, making it easier to track progress and manage timelines.
Your activities should highlight every element required to complete the project as per your stakeholders and customer’s expectations.
Tip #3. Schedule your tasks
You’ve mapped the key activities and gathered the basic project details; now, it’s time to schedule your project tasks against a timeline.
Nifty’s task-scheduling feature is the stuff of legends. Its drag-and-drop functionality makes it extremely easy to extend or shorten your task’s duration:
Here are a few handy tips to remember when creating your tasks:
- When creating your tasks, spell it out as definitively as possible
- Organize tasks into phases to make the project plan easier to understand
- Add important documents, notes, and files to the task so that the team is always aware of the task’s intent
- Label tasks according to which team, department, or client is responsible for it
- Add the right start and end dates for the task but ask the team first to get a sense of the team’s availability
- Don’t forget about holidays, time offs, etc., when scheduling the task
- Ask the team’s feedback to see if everything is working well or not
Tip #4. Set critical milestones
Adding milestones to your Gantt chart allows you to effortlessly manage time-sensitive deadlines, approvals, meetings, and key deliverables.
Given how important they are, Nifty makes this process easy. Simply click on the “Add a Milestone” button to get going, as shown below:
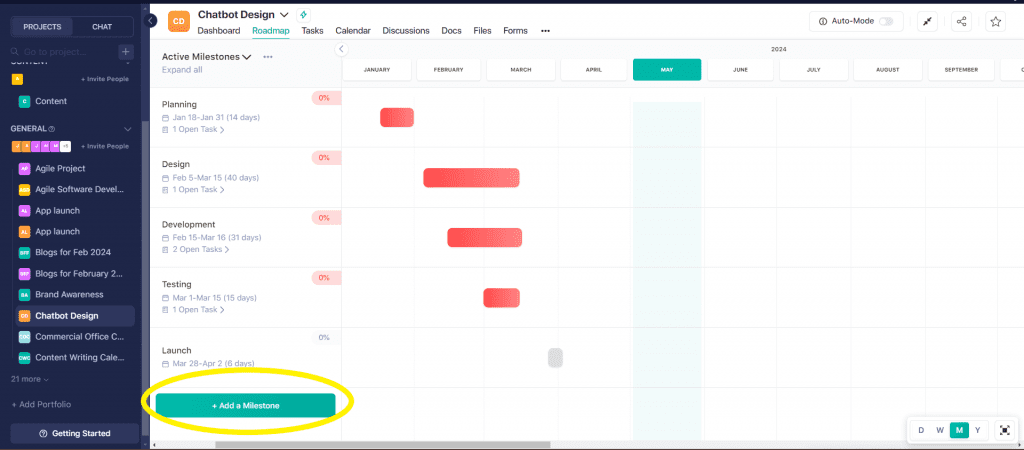
The best part? You can add as many Milestones as needed and break the project into a list of smaller, more manageable tasks.
To create milestones effectively, use these tips to your advantage:
- Identify the right milestones, and group them properly: As an example, consider a project manager who is part of the software development team working on a website launch. In this case, the milestones list will read as getting end client approvals, working on user feedback of the first prototype, and so on. When grouping the milestones, trust your intuition and group them logically
- Simplify the project by going granular: Break your project into granular subtasks to motivate the team without making them feel overwhelmed by the sheer workload. The better you define the tasks and the more granular you go, the easier it will be for you to get work done quickly and more productively
- Set realistic dates: Assign realistic dates for each milestone. You can leverage the Specific, Measurable, Achievable, Realistic, and Time-bound (S.M.A.R.T) framework to set practical deadlines
- Use descriptive names: Give each milestone a clear, descriptive name that clearly elucidates its purpose
Set milestones and track them using Nifty. Get Started Free.
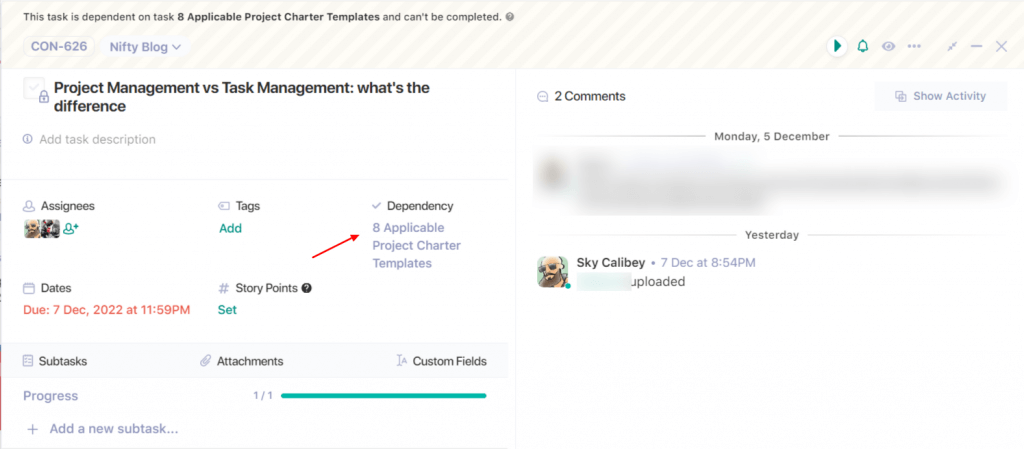
Tip #5. Add dependencies to strategic tasks
With your milestones and tasks properly scheduled, it’s time to set your task dependencies.
Dependencies are nothing but the order in which your tasks must be completed. As you can imagine, this helps you manage the project timelines effectively.
A robust Gantt chart allows you to set dependencies for your task so that your project flows smoothly.
Here are a few tips to keep in mind when adding the dependencies:
- Identify critical path tasks: Focus on tasks, or the critical path, that directly impact the project timeline
- Consider lag and lead time: Lag time is a delay between dependent tasks. On the other hand, lead time allows overlap. As a thumb rule, you must adjust these to reflect your project’s real-world conditions. For example, if Task B can start two days after Task A begins, you must add a lead time
- Communicate clearly with your team: Ensure all team members understand the dependencies—and their impact on the overall project plan
- Leverage a strategic project management tool: Use features in your project management software to easily set and adjust dependencies. Tools like Nifty allow you to visualize dependencies and see the relationships between tasks at first glance
Tip #6. Assign roles and responsibilities to the right people
A project is incomplete without the right people planning and managing it. Here’s how to ensure you’ve got the best team in place:
- Assign tasks based on expertise: Match tasks with team members who have the right skills and expertise. For example, you can assign complex coding tasks to developers with a proven track record in similar projects
- Keep the team involved: Make sure everyone knows their responsibilities and what’s expected of them. Make sure to roll out detailed job descriptions and task outlines to avoid confusion and chaos
- Use a workload management tool: Assign tasks based on individual strengths and workloads to keep the project balanced. This is where using a workload management tool pays off as it allows you to distribute tasks evenly and prevent burnout
- Clearly explain the goals to each team member: Our suggestion would be to conduct a project kickoff meeting to discuss project objectives. Invite everyone involved from top to bottom so that everyone can get to know each other from the get-go
- Offer one-click resources: A tried-and-tested strategy for assigning team members the right roles is simply asking them. To help them get a better sense of their responsibility, improve your training programs, integrate mentorship sessions at strategic intervals, and help them work faster with an easy-to-use project management tool
- Check in regularly to see how your tasks are shaping up: Use an all-in-one productivity-driven project management software like Nifty to track progress and identify potential roadblocks early on in the project management process
Tip #7. Keep going back to your dynamic Gantt chart
Keeping your Gantt chart up-to-date enables project managers to stay on top of their project’s evolving demands. In other words, don’t set it and forget it!
Here’s how you can keep your Gantt chart updated and relevant:
- Drive regular check-ins: Schedule weekly or bi-weekly reviews of your Gantt chart. During these check-ins, assess the progress of each task and identify delays to ensure the entire project stays on track
- Adjust timelines: If a task is falling behind, update its timeline and adjust subsequent tasks accordingly. Similarly, if a task is completed ahead of schedule, you can bring forward dependent tasks
- Update the task status: Use clear indicators to mark tasks as completed, in progress, or delayed. This visual representation helps everyone on the team quickly grasp the current state of the project
- Communicate changes: When you make updates, communicate these changes to your team immediately. Use team meetings and emails to ensure everyone is aware of the new timelines and/or expectations
- Use a real-time tool: Invest in a project management software solution that supports real-time updates. Tools like Nifty allow team members to see changes as they happen, foster better collaboration, and drive better response times
- Incorporate feedback: After each milestone and task gets completed, gather feedback from the horse’s mouth—your team. Use this feedback to pivot your Gantt chart strategy and improve the way you work for future projects
- Monitor critical path: Pay extra attention to tasks on the critical path, as delays here will directly impact your project’s completion date
Create a Gantt Chart with ease using Nifty.
Get Started Free
Gantt Chart Templates for Project Management
Now let’s look at the basic components of a Gantt chart template for managing projects:
- Timeline: Shows the project duration in manageable segments such as days, weeks, months, or year
- Tasks: Lists project activities and phases vertically
- Bars: Represents each task’s start and end dates on the timeline; visualize task durations and overlaps
- Dependencies: Shows the order in which tasks must be completed
- Milestones: Marks significant project achievements and deadlines
- Visualization: Helps plan, schedule, and monitor project progress easily
So, keeping these touchpoints in mind, you should use a Gantt chart if:
- Your project has a fixed end date
- You need to involve multiple people and teams that need to sync efforts
- You need to arm your stakeholders with a clear project timeline
- You need to tackle complex projects with tasks that have specific dependencies and sequences
- Team members are juggling multiple projects and need to be constantly managed
- You have a general idea of how long each task will take
When to Avoid Using Gantt Charts?
Just like there are certain scenarios where you must use Gantt charts, there are also instances where you shouldn’t use one, such as:
When you’re just starting out planning the project
Using a Gantt chart right at the start isn’t ideal.
Before you can create an effective Gantt chart, you need a clear understanding of the major tasks, their durations, and their sequence.
If you start with a Gantt chart too early, you risk missing crucial steps and having to redo the chart once those gaps are identified.
When you want to manage resources
Gantt charts excel at displaying timelines but fall short in detailing resource allocation.
They don’t show the nuances of resource requirements like team members, equipment, or budget.
At its core, while Gantt charts are great for scheduling, you should use additional tools to manage resources effectively.
When you are planning to create a Gantt chart manually
Make no mistake, manually creating Gantt charts in Excel or similar programs is labor-intensive and inflexible.
If a task duration changes or a step is added, updating the chart can become a real pain.
Instead, invest in project management software with Gantt chart features like Nifty, which allows for automatic adjustments, saves you valuable time, and reduces errors.
Top 3 Gantt Chart Software
Here are the top 3 Gantt chart software.
1. Nifty
Nifty offers a robust Gantt chart software solution that stands out for its simplicity and efficiency. This software provides an intuitive interface that makes it easy to create and manage project timelines. Key features of Nifty include:
- Automatic Updates: Automatically update progress as tasks are completed, saving you the hassle of manual updates.
- Task Dependencies: Supports task dependencies and milestones.
- Multiple Views: Offers multiple project views to cater to different management styles.
- Integration: Integrates with various collaboration tools, ensuring teams can stay in sync.
Nifty’s Gantt chart software is not just about visualizing tasks; it also offers a comprehensive way to manage project deadlines and deliverables in real-time.
2. Smartsheet
Smartsheet is renowned for its powerful Gantt chart capabilities, combining the simplicity of a spreadsheet with robust project management features. Highlights of Smartsheet include:
- Customization: Highly customizable Gantt charts that can be tailored to specific needs.
- Complex Scheduling: Supports complex project schedules with task dependencies and critical path visualization.
- Real-Time Collaboration: Offers real-time collaboration features.
- Integration: Extensive integration capabilities with popular tools like Microsoft Office, Google Workspace, and Slack.
- Analytics: Provides valuable insights into project performance through reporting and analytics tools.
Smartsheet’s Gantt chart software is an excellent choice for teams that require a flexible and interoperable project management solution.
3. ClickUp
ClickUp is an online Gantt chart software that is both user-friendly and highly functional. This software caters to a wide range of project management needs, from simple task tracking to complex project scheduling. Key aspects of ClickUp include:
- Visualization: Allows users to visualize project timelines and set task dependencies.
- Resource Management: Effectively manages resources across multiple projects.
- Comprehensive Overview: Handles multiple projects within a single view, providing a comprehensive overview of all tasks and deadlines.
- Real-Time Collaboration: Supports real-time collaboration, ensuring instant updates and communication.
- Integration: Integrates with numerous third-party applications, enhancing its versatility.
ClickUp’s Gantt chart software is a top choice for teams seeking a cohesive and comprehensive project management solution.
Represent Projects Visually with Easy-to-Use Gantt Charts from Nifty
There you go. You no longer need to get intimidated by complex-looking Gantt charts anymore.
Nifty helps you create simple Gantt charts representing your project’s timeline, status, and who is responsible for what. Next time, don’t let a horizontal bar chart give you the jitters. Use Nifty to capture all-important project details in a digestible, easy-to-understand manner.
Sign up for free to get started with your Gantt chart!